

In pursuit of bolstering their positions in the realm of global economic and political influence, the BRICS coalition, comprising Brazil, Russia, India, China, and South Africa—a dynamic multi-continent economic and political bloc—made a significant announcement in August 2023. They extended their embrace by inviting six new members to join their ranks in January 2024, expanding the group’s horizons to encompass Argentina, Egypt, Ethiopia, Iran, Saudi Arabia, and the United Arab Emirates. This move signified a strategic effort to unite top emerging economies, creating a formidable force on the global stage.
In this piece, our analyst delves into the innovation ecosystems of both the established BRICS members and the newcomers. The aim is to discern the level of competitiveness within this esteemed group. Drawing upon the wealth of annual data provided by the World Intellectual Property Organisation (WIPO) and a consortium of research teams hailing from diverse countries across the Global North and South, our analyst conducted a comprehensive examination.
Exhibit 1: Average performance between 2013 and 2022
Register for Tekedia Mini-MBA edition 20 (June 8 – Sept 5, 2026).
Register for Tekedia AI in Business Masterclass.
Join Tekedia Capital Syndicate and co-invest in great global startups.
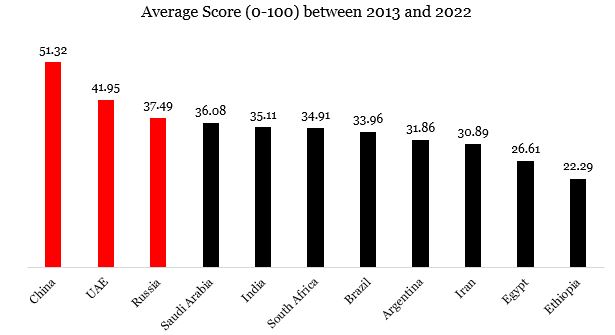
Over the span of a decade, the analysis revealed intriguing patterns and trends. On average, China, the United Arab Emirates, and Russia consistently outperformed the other members, including the recently added newcomers. This suggests a degree of established strength and innovation prowess within these three countries that sets them apart. However, one of the most surprising insights to emerge from our analysis was the remarkable global competitiveness of the United Arab Emirates, despite being a newly inducted member. This revelation underscores the rapid development and strategic investments made by the UAE in fostering an innovation ecosystem that can compete on a global scale.
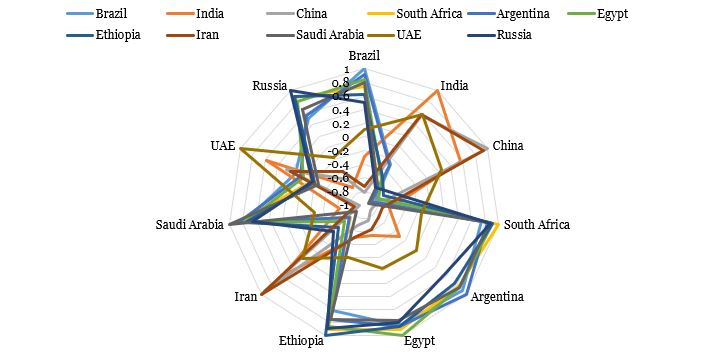
China exhibits a negative correlation with several countries, including Brazil, South Africa, Argentina, Egypt, Ethiopia, Saudi Arabia, and Russia. This suggests that China’s performance in innovation competitiveness tends to vary inversely with these nations. In other words, when China’s competitiveness in the innovation ecosystem increases, the competitiveness of these countries tends to decrease. On the flip side, China displays a positive correlation with India, Iran, and the United Arab Emirates. This implies that as China’s innovation ecosystem competitiveness rises, these countries tend to experience corresponding increases in their own competitiveness.
Exhibit 2: Frequency of positive and negative linkages of BRICS’s and AEEISU’s Innovation Index

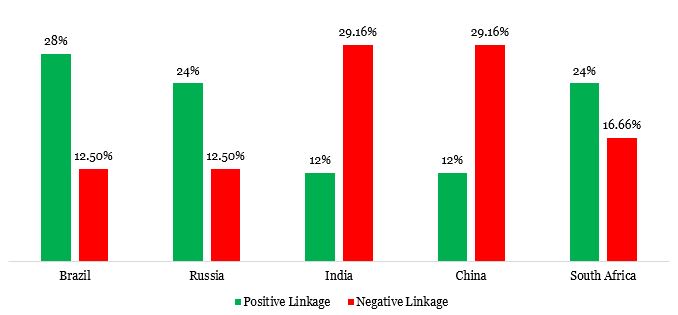
Russia, like China, shows a negative correlation with several countries, including India, Iran, and the UAE. This suggests that when Russia’s innovation ecosystem competitiveness improves, these nations tend to experience decreased competitiveness. Conversely, Russia exhibits a positive correlation with Brazil, South Africa, Argentina, Egypt, Ethiopia, Saudi Arabia, and Russia itself. This means that as Russia’s innovation ecosystem competitiveness strengthens, these countries tend to see improvements in their own competitiveness. India demonstrates a negative correlation with Brazil, South Africa, Argentina, Egypt, Ethiopia, Saudi Arabia, and Russia. This implies that when India’s innovation ecosystem competitiveness increases, these countries tend to experience a decrease in their own competitiveness. India, on the other hand, shows a positive correlation with China, Iran, and the UAE. This suggests that as India’s innovation ecosystem competitiveness improves, these countries tend to see corresponding improvements in their own competitiveness.
South Africa displays a negative correlation with India, China, Iran, and the UAE. This indicates that when South Africa’s innovation ecosystem competitiveness rises, these countries tend to witness a decline in their own competitiveness. In contrast, South Africa has a positive correlation with Brazil, Argentina, Egypt, Ethiopia, Saudi Arabia, and Russia. This means that as South Africa’s innovation ecosystem competitiveness strengthens, these countries tend to experience enhancements in their own competitiveness.
Brazil exhibits a negative correlation with India, China, and Iran. When Brazil’s innovation ecosystem competitiveness increases, these nations tend to see decreases in their own competitiveness. Brazil demonstrates a positive correlation with South Africa, Argentina, Egypt, Ethiopia, Saudi Arabia, the UAE, and Russia. As Brazil’s innovation ecosystem competitiveness improves, these countries tend to witness corresponding improvements in their own competitiveness.

Exhibit 3: Concentric of Innovation Index of the BRICS and AEEISU
As the BRICS alliance expands its horizons and welcomes these new members, the dynamics of the group’s innovation landscape are poised for transformation. The blending of experiences, resources, and expertise from both the old and new members promises to shape the future of global innovation and economic influence in exciting and unforeseen ways. This development underscores the importance of continually monitoring and analyzing the evolving innovation ecosystems of these nations, as they collectively aim to chart the course for a new era in global economic and political affairs.