


Two SaaS companies both sell a $300 plan, yet their Google Ads budgets couldn’t be further apart. One enjoys 80 percent gross margins, multi-year retention, and steady seat expansion; the other loses 8 percent of its customers every month. Plan price is only sticker revenue. What funds search advertising is gross-margin lifetime value (LTV), fast cash payback, and enough high-intent search demand. In this guide, you’ll learn how to turn those numbers into a defensible Google Ads budget for SaaS, and how to scale spend only while marginal CAC stays profitable.
Why plan price produces the wrong Google Ads budget
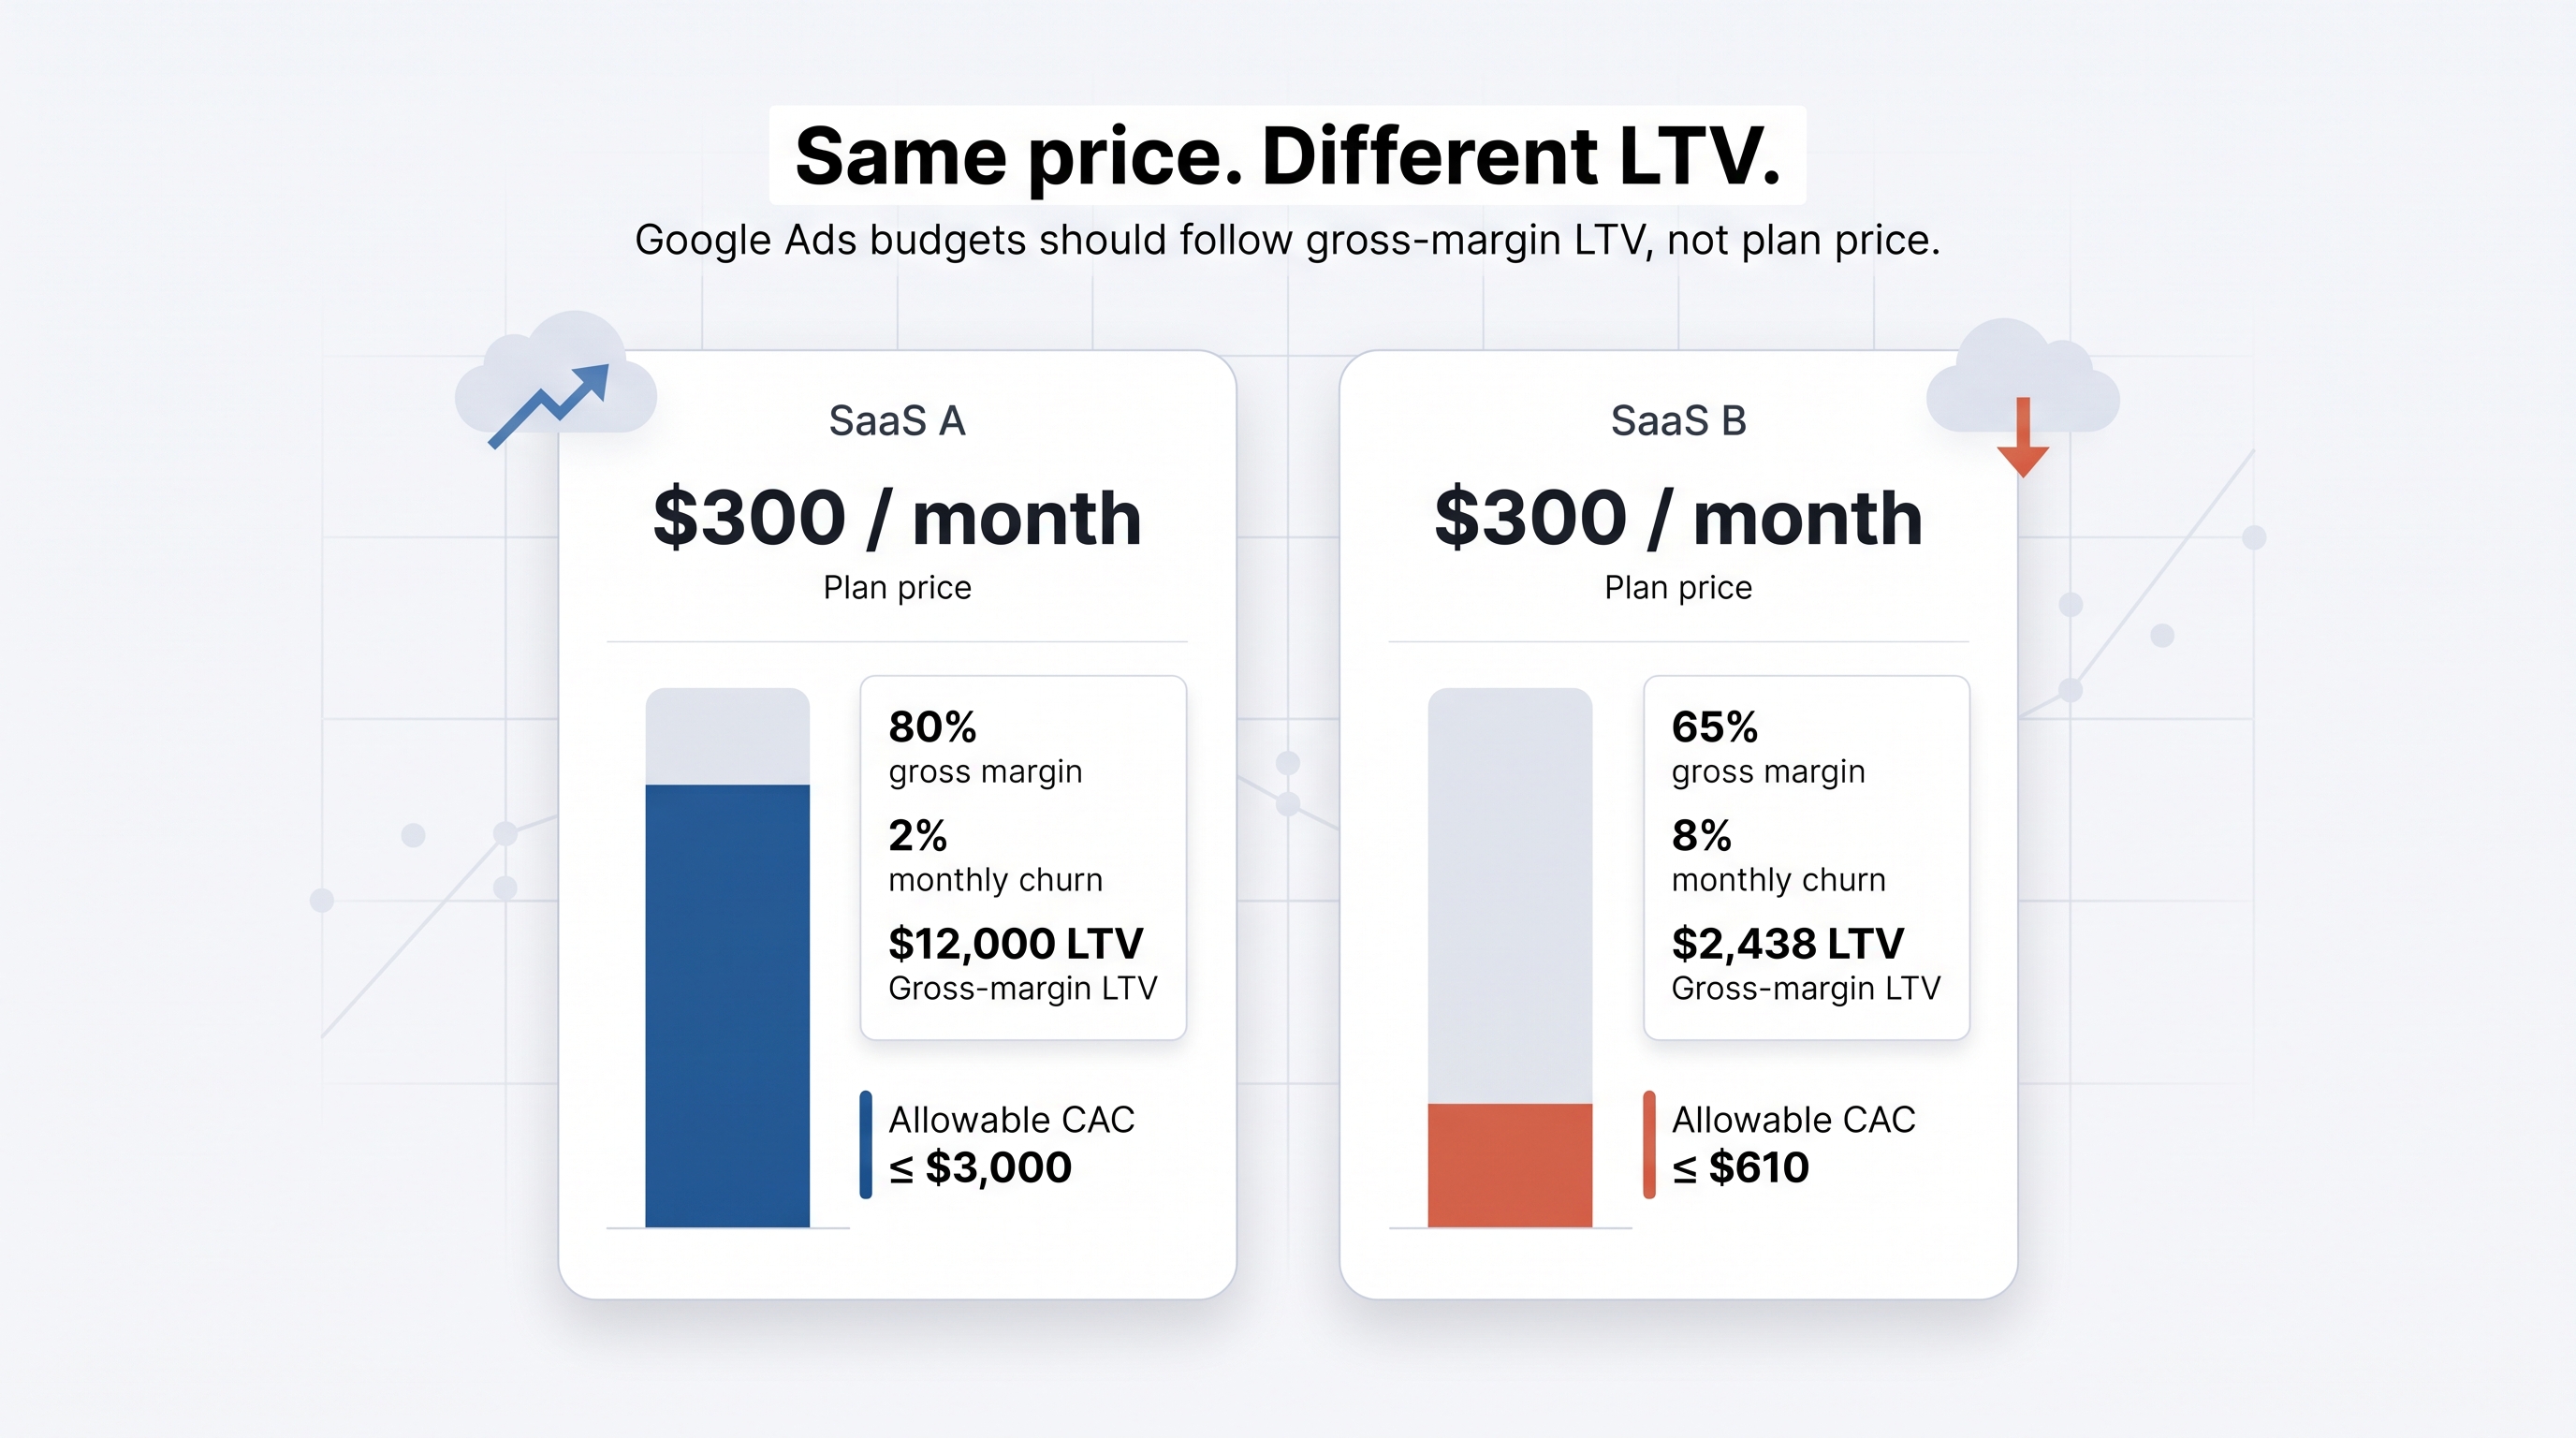
A subscription’s sticker price shows revenue, not profit. Google charges your ad spend upfront, yet you recoup that cash only as gross-margin dollars arrive with each renewal. Two SaaS firms can both charge $300 a month and still have radically different room for a Google Ads budget once margin and churn enter the math.
| Input | SaaS A | SaaS B |
| Monthly price | $300 | $300 |
| Gross margin | 80 percent | 65 percent |
| Monthly churn | 2 percent | 8 percent |
| Gross-margin LTV | $12,000 | $2,438 |
| Allowable paid CAC* | ? $3,000 | ? $610 |
*Assumes a 4 : 1 LTV-to-CAC target, closely aligning with the 2026 B2B SaaS median of 4.1 : 1.
SaaS A can spend up to three thousand dollars to acquire a customer because healthy margin and low churn stretch profit over roughly four years. SaaS B, facing shorter lifetimes and thinner margin, has just six hundred dollars: too tight for most auctions.
Platform metrics often mask this gap. Google’s CPA shows what it cost to trigger a form fill; paid-media CAC spreads ad spend across real customers; fully loaded CAC adds salaries, commissions, and tooling. Only the last figure reflects the cash you spend.
Treat plan price as a starting hint, then build the budget from gross-margin LTV and cash payback. Otherwise, you end up funding churn instead of growth.
Step 1: calculate gross-margin LTV by cohort
Use a simple, conservative formula
Customer lifetime value anchors every downstream metric. Start with a transparent equation:
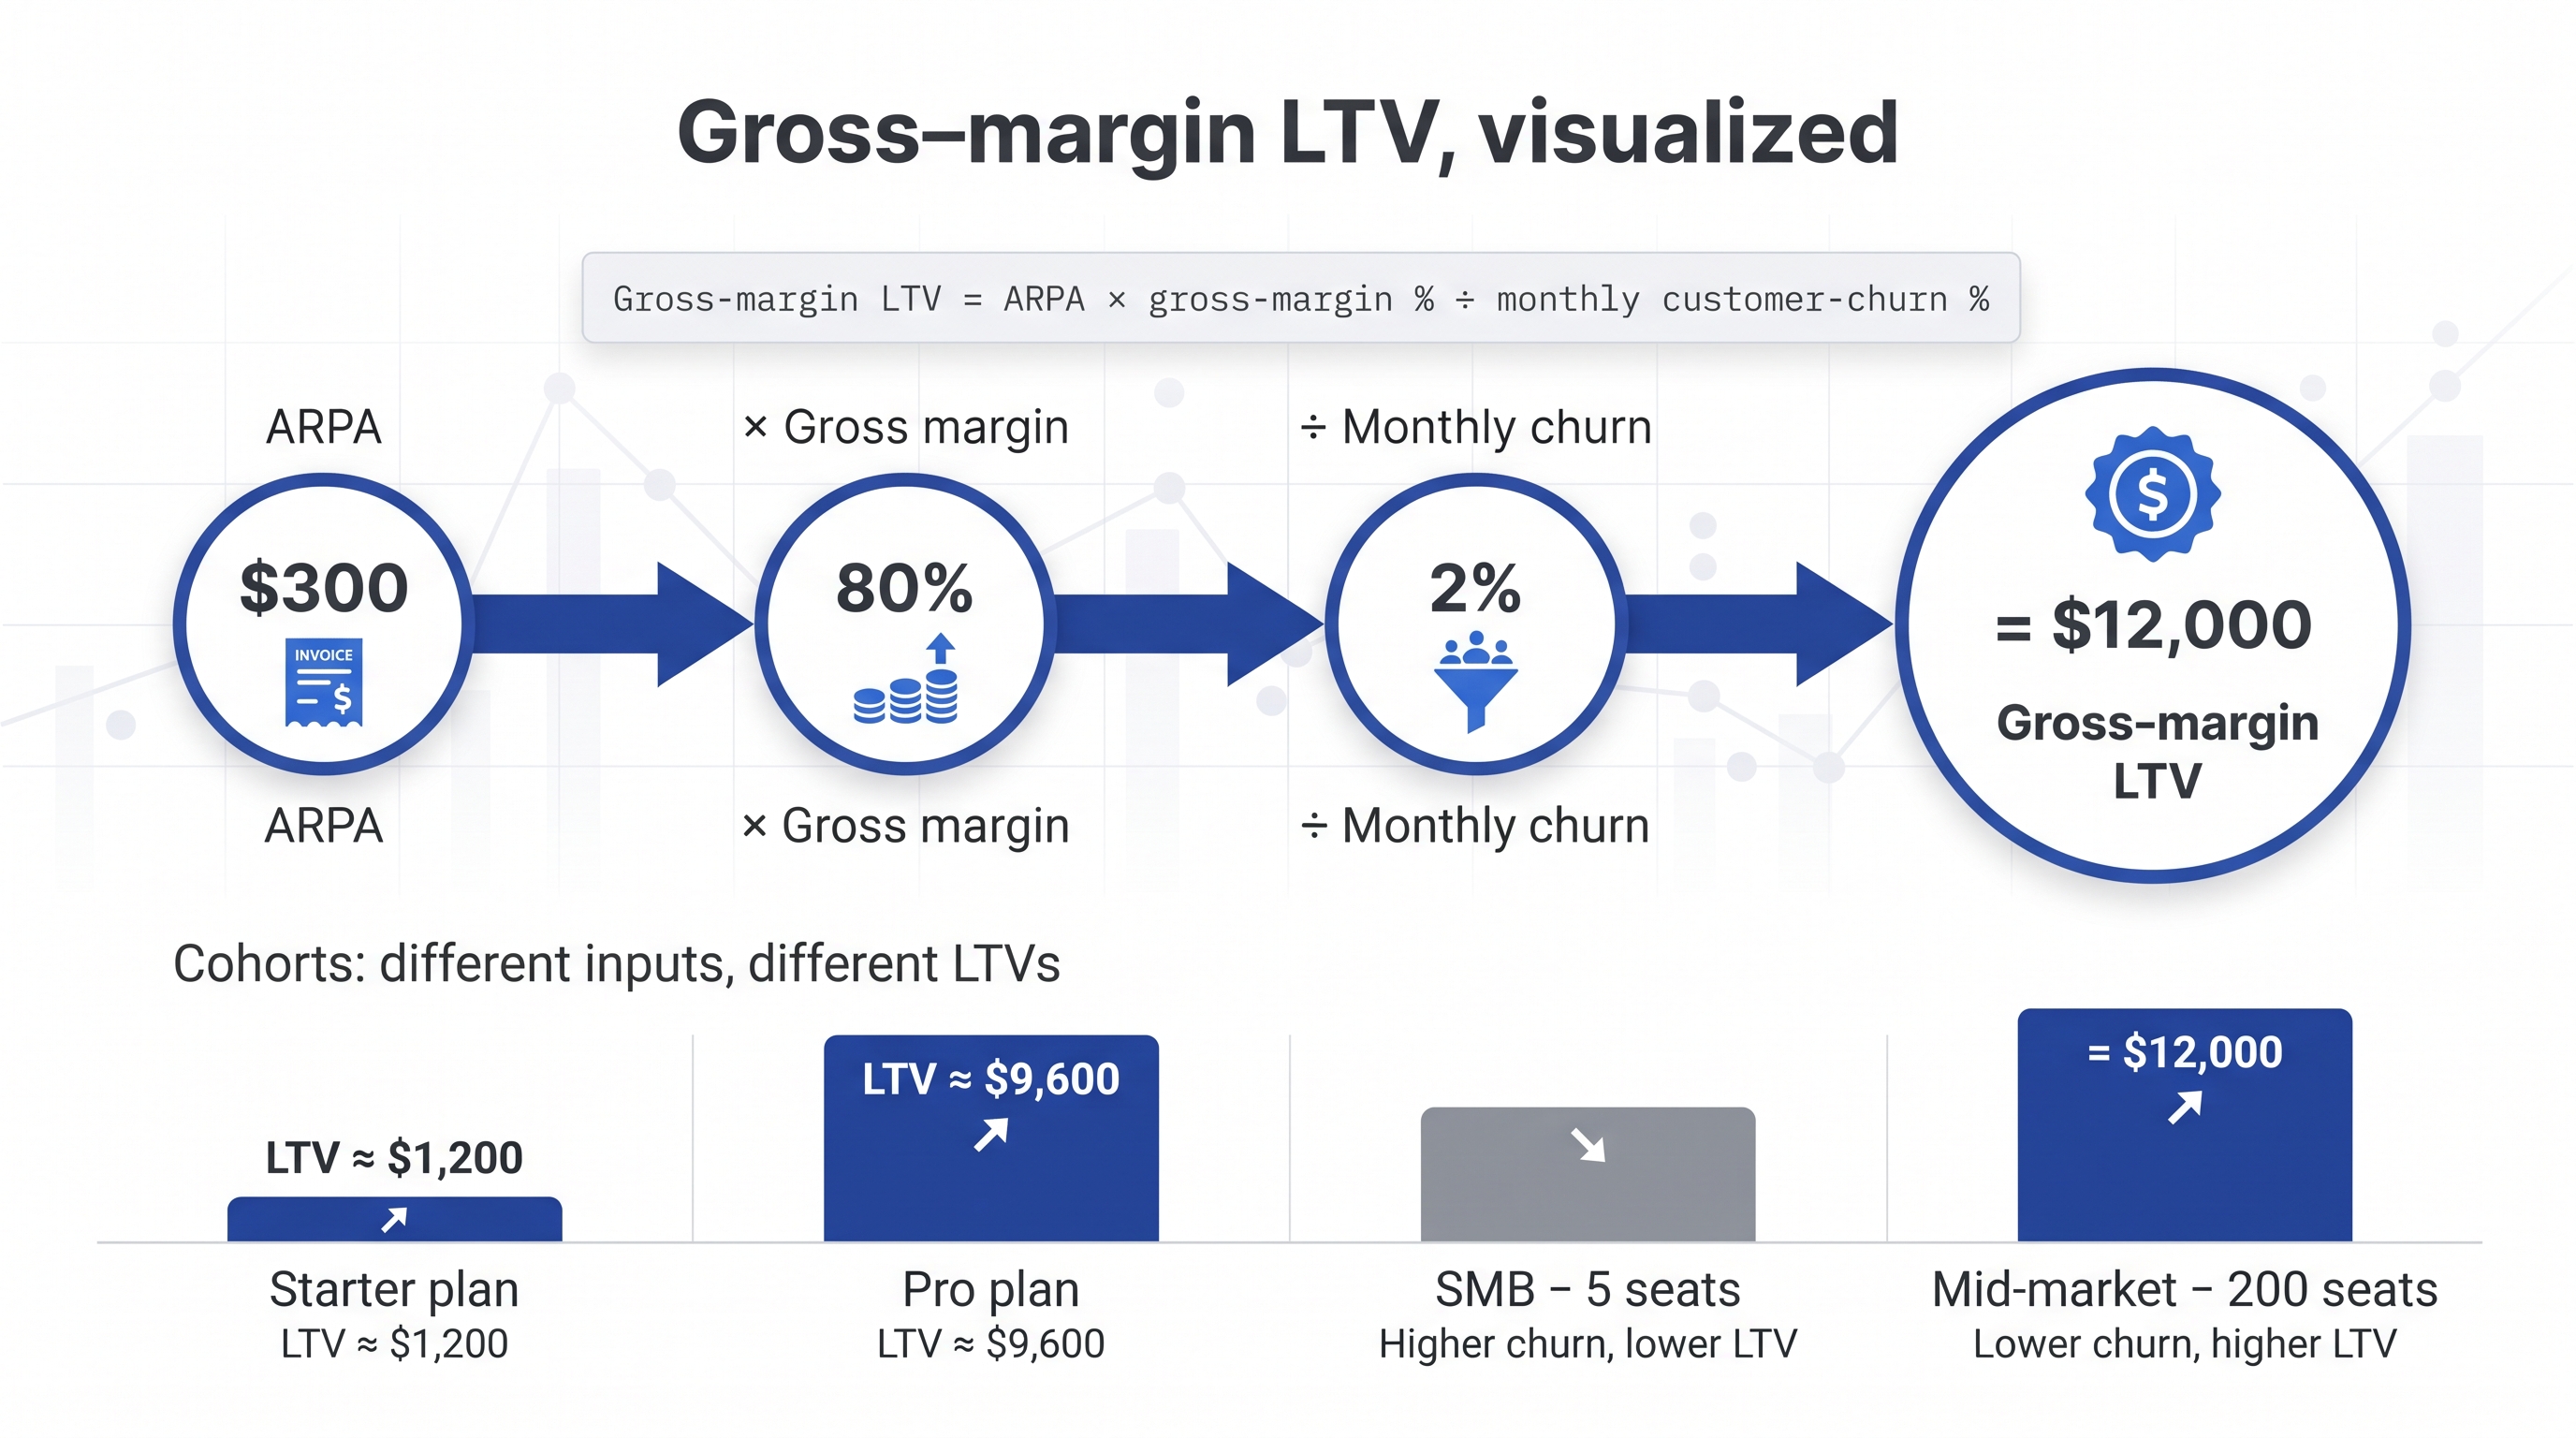
Gross-margin LTV = ARPA × gross-margin % ÷ monthly customer-churn %
Keep ARPA and churn in the same time period. Multiplying by gross margin strips out delivery cost and shows the profit you can recycle into acquisition. It is a practical starting point: curve-fit models often overstate value when early churn is high.
Example.
ARPA $300 × 80 percent gross margin ÷ 2 percent monthly churn = $12,000 gross-margin LTV.
Segment before you average
Feed Google one blended lifetime value and the algorithm will chase the cheapest clicks that look like your “average” user, often the least profitable cohort. Instead, slice LTV anywhere profit diverges:
- Plan tier: Starter users might return $1,200, whereas Pro customers deliver $9,600.
- Company size: A five-seat SMB contract usually churns faster than a 200-seat mid-market deal.
- Geography: if U.S. customers churn 2 percent a month and LATAM users 6 percent, the U.S. cohort is worth three times as much at the same price.
- Motion: Self-serve buyers rarely expand the way sales-assisted teams do.
For Reputation Trojan, a review-management SaaS, PPC Masterminds multiplied conversion volume 1.75x and cut cost per conversion by more than 55 percent after six months of working together.
A sound way to reach results like that is to start with a small test budget that confirms real CPC and conversion rates before any scale. PPC Masterminds’ guide How Much Should I Spend on Google Ads explains why a test budget comes first and how earn-per-click (conversion rate multiplied by customer value) shows which keywords can pay for themselves before you spend more.
Recalculate gross-margin LTV for each bucket and import those values through offline conversions or Value Rules so every bid, budget, and creative reflects true return potential.
Guard against over-optimism when data is thin
Early cohorts can look heroic: a few annual contracts renew, expansion bumps revenue, churn seems negligible. Then the next wave lands and reality bites. Benchmarkit’s 2026 report shows median gross revenue retention fell to 84 percent, meaning a typical SaaS business loses 16 percent of baseline revenue each year before counting an upsell.
Model three futures (downside, base, and upside) and build the budget around the cautious case. Cap lifetime at a realistic horizon instead of projecting near-zero churn forever, and exclude expansion revenue until it repeats in mature cohorts. If finance wants payback inside 12 months, tighten allowable CAC even when a rosy spreadsheet says “increase bids.” Scenario discipline converts optimism into options, not surprises.
Step 2: turn LTV into an allowable paid CAC
Set the fully loaded CAC ceiling
Gross-margin LTV shows what each customer is worth. The next task is to cap how much of that value can fund acquisition. The old rule of thumb was a 3:1 LTV-to-CAC ratio, but Benchmarkit’s 2026 study puts the B2B SaaS median at 4.1:1. Stricter ratios protect cash and reassure boards that less than one-quarter of lifetime profit goes to acquisition.
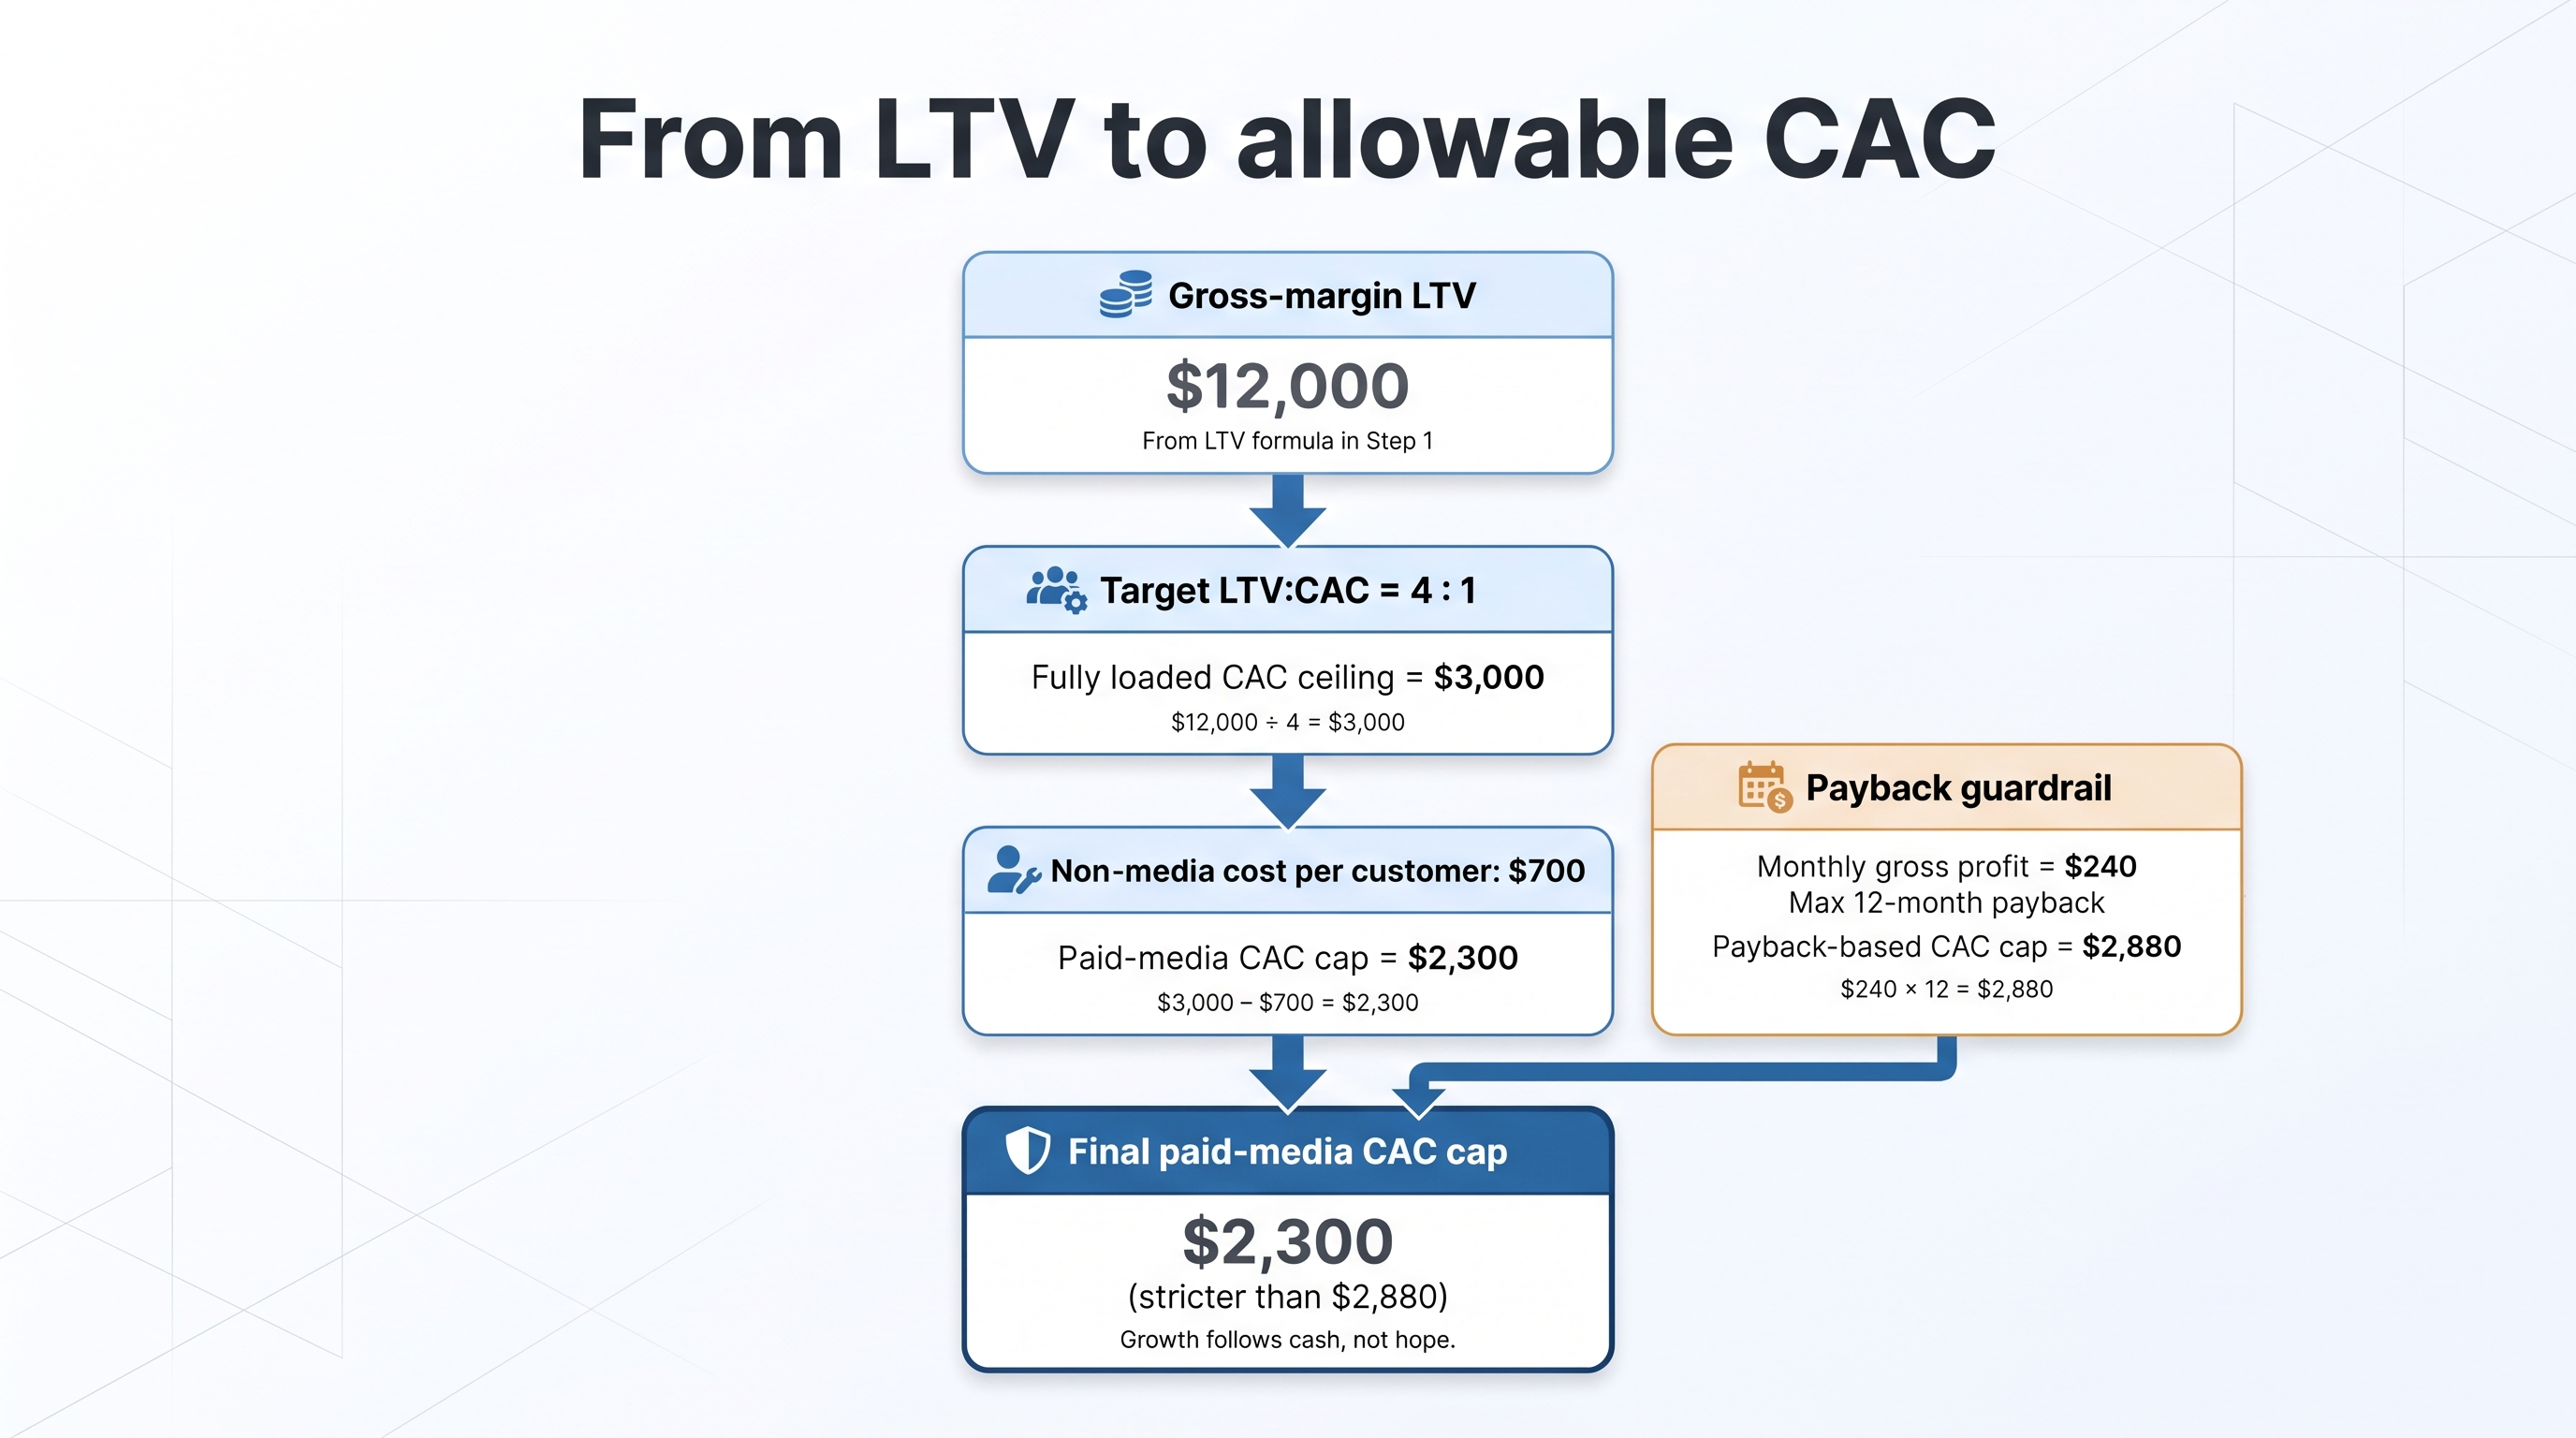
Allowable fully loaded CAC = gross-margin LTV ÷ target LTV:CAC
“Fully loaded” covers every repeatable acquisition expense: salaries, commissions, tools, contractors and conferences, not just media.
Numeric snapshot
If gross-margin LTV equals $12,000 and the target ratio is 4:1, the fully loaded CAC ceiling is $3,000.
This ceiling is the starting point for your paid-media cap.
Carve out non-media costs and apply a payback guardrail
Allowable media CAC = fully loaded CAC ceiling ? non-media cost per customer
Payback-based CAC cap = monthly gross profit × maximum payback months
Take the lower of these two caps. SaaS firms with payback inside 12 months ride out funding cycles more easily; longer payback ties up working capital.
Numeric snapshot
From a $3,000 fully loaded ceiling, subtract $700 in sales salaries and tooling to reach a $2,300 media CAC cap. With monthly gross profit of $240 ($300 ARPA × 80 percent margin), a 12-month payback allows $2,880. Choose the stricter $2,300. Growth follows cash, not hope.
Use this cap as a hard limit. The next steps will convert it into allowable CPL, CPC and operating budget.
Step 3: work backward from customer goal to maximum CPC
Map the funnel in reverse
Begin with the outcome: how many new customers must Google Ads deliver each month? Then move upstream, stage by stage.
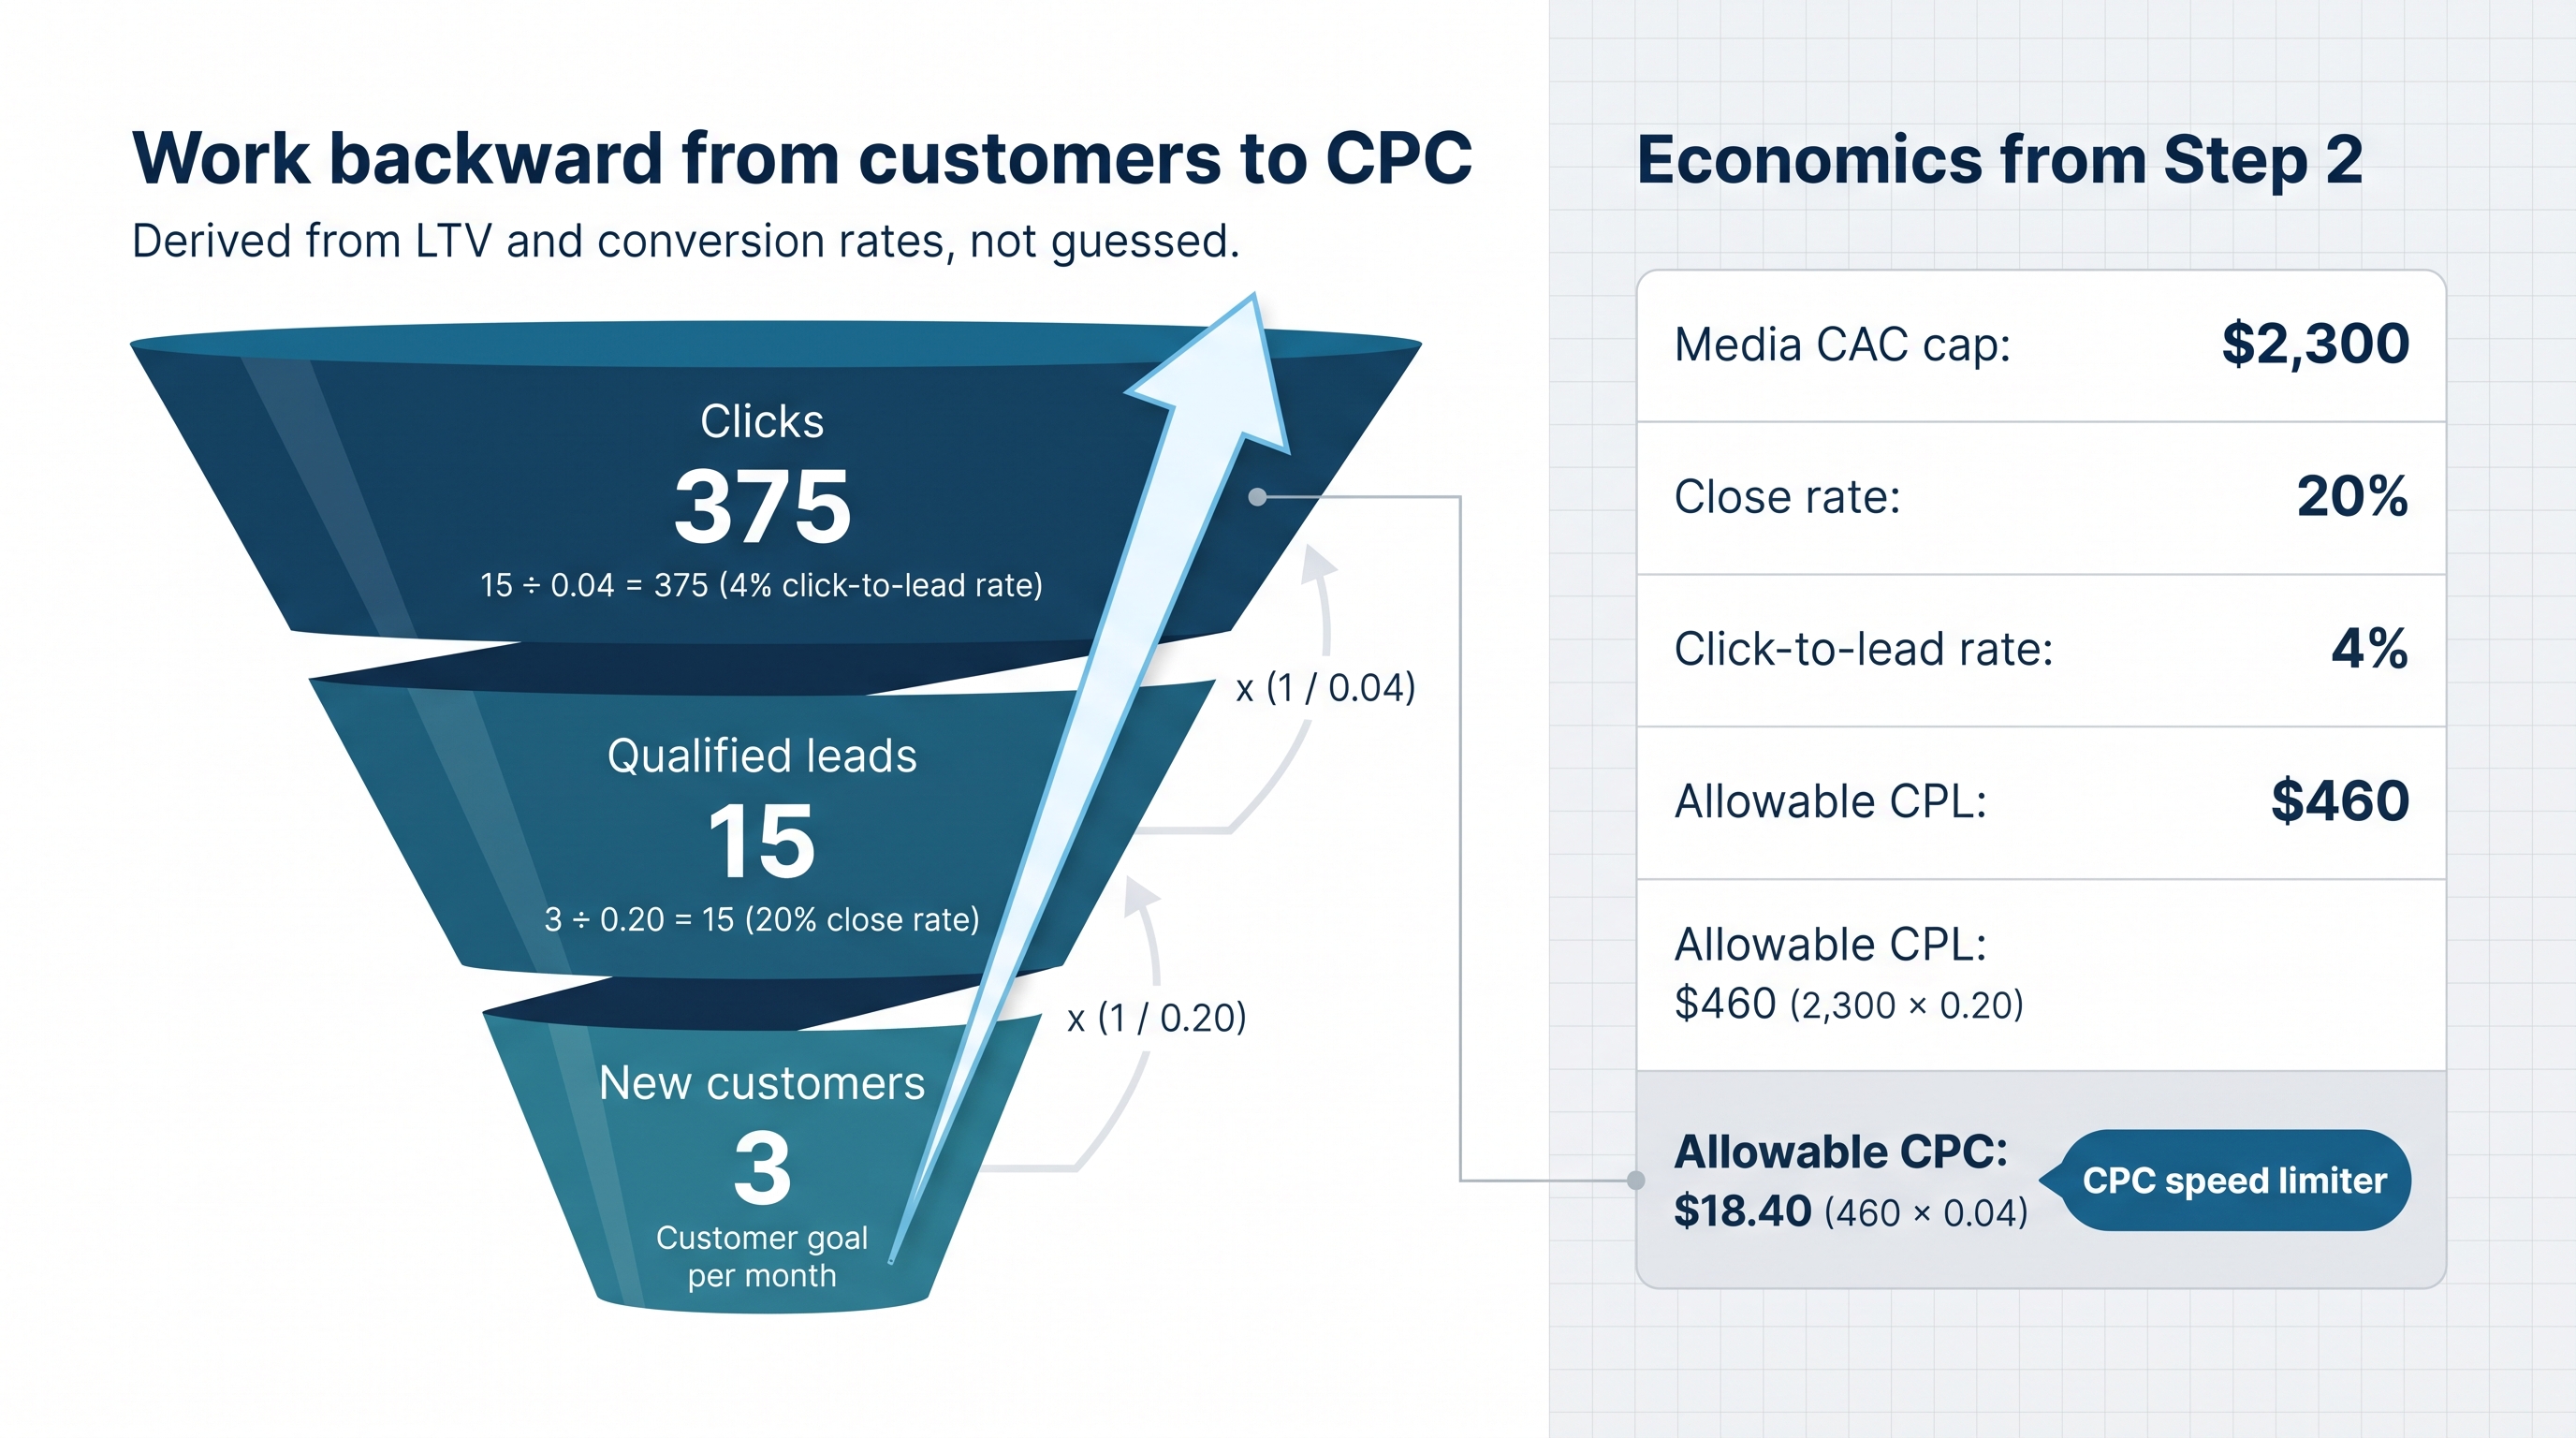
Qualified leads required = customer goal ÷ lead-to-customer close rate
Allowable CPL = media CAC cap × close rate
Allowable CPC = allowable CPL × click-to-lead rate
Benchmarks can ground your assumptions. HubSpot data pegs the average win rate at 21 percent, and Metadata’s study of 56 B2B advertisers shows a Google Ads click-to-lead rate of 1.9 percent. High-performing accounts beat those figures, but they give defensible starting points.
Numeric snapshot
- Customer target??????? 3
- Close rate (win rate)???????? 20 percent
- Click-to-lead rate???????? 4 percent
- Media CAC cap???????? $2,300
- Qualified leads required = 3 ÷ 0.20 = 15
- Allowable CPL = $2,300 × 0.20 = $460
- Allowable CPC = $460 × 0.04 = $18.40
Treat $18.40 as a speed limiter: bids and budgets should stay below it unless retention, conversion or LTV rise. This discipline keeps every funnel stage tied to profit.
Build the funnel backward
The same three-step math applies whenever targets change. Enter a fresh customer goal or an updated close rate, then recalculate leads, CPL and CPC. Revisit the numbers each quarter to keep bids in line with real-time conversion data.
A worked example in real numbers
Plug real values into the framework to cement the math:
- ARPA: $300
- Gross margin: 80 percent
- Monthly churn: 2 percent
Gross-margin LTV = $300 × 80 percent ÷ 2 percent = $12,000
Fully loaded CAC ceiling = $12,000 ÷ 4 = $3,000
Paid-media CAC cap = $3,000 ? $700 = $2,300
Assume the sales team wins 20 percent of qualified leads and landing pages convert 4 percent of clicks.
Customer goal: three new accounts
| Stage | Math | Result |
| Qualified leads | 3 ÷ 0.20 | 15 |
| Clicks needed | 15 ÷ 0.04 | 375 |
| Allowable CPL | $2,300 × 0.20 | $460 |
| Allowable CPC | $460 × 0.04 | $18.40 |
At a forecast $12 CPC, expected spend is $4,500, well below the economic ceiling of $6,900 (375 clicks × $18.40 cap). If average CPC rises to $20, forecast spend reaches $7,500, which breaks the cap.
The rule for any Google Ads budget for SaaS is blunt: when projected spend breaches the cap, fix conversion rates or increase lifetime value; do not raise the budget ceiling.
Step 4: make the budget pass three boundaries
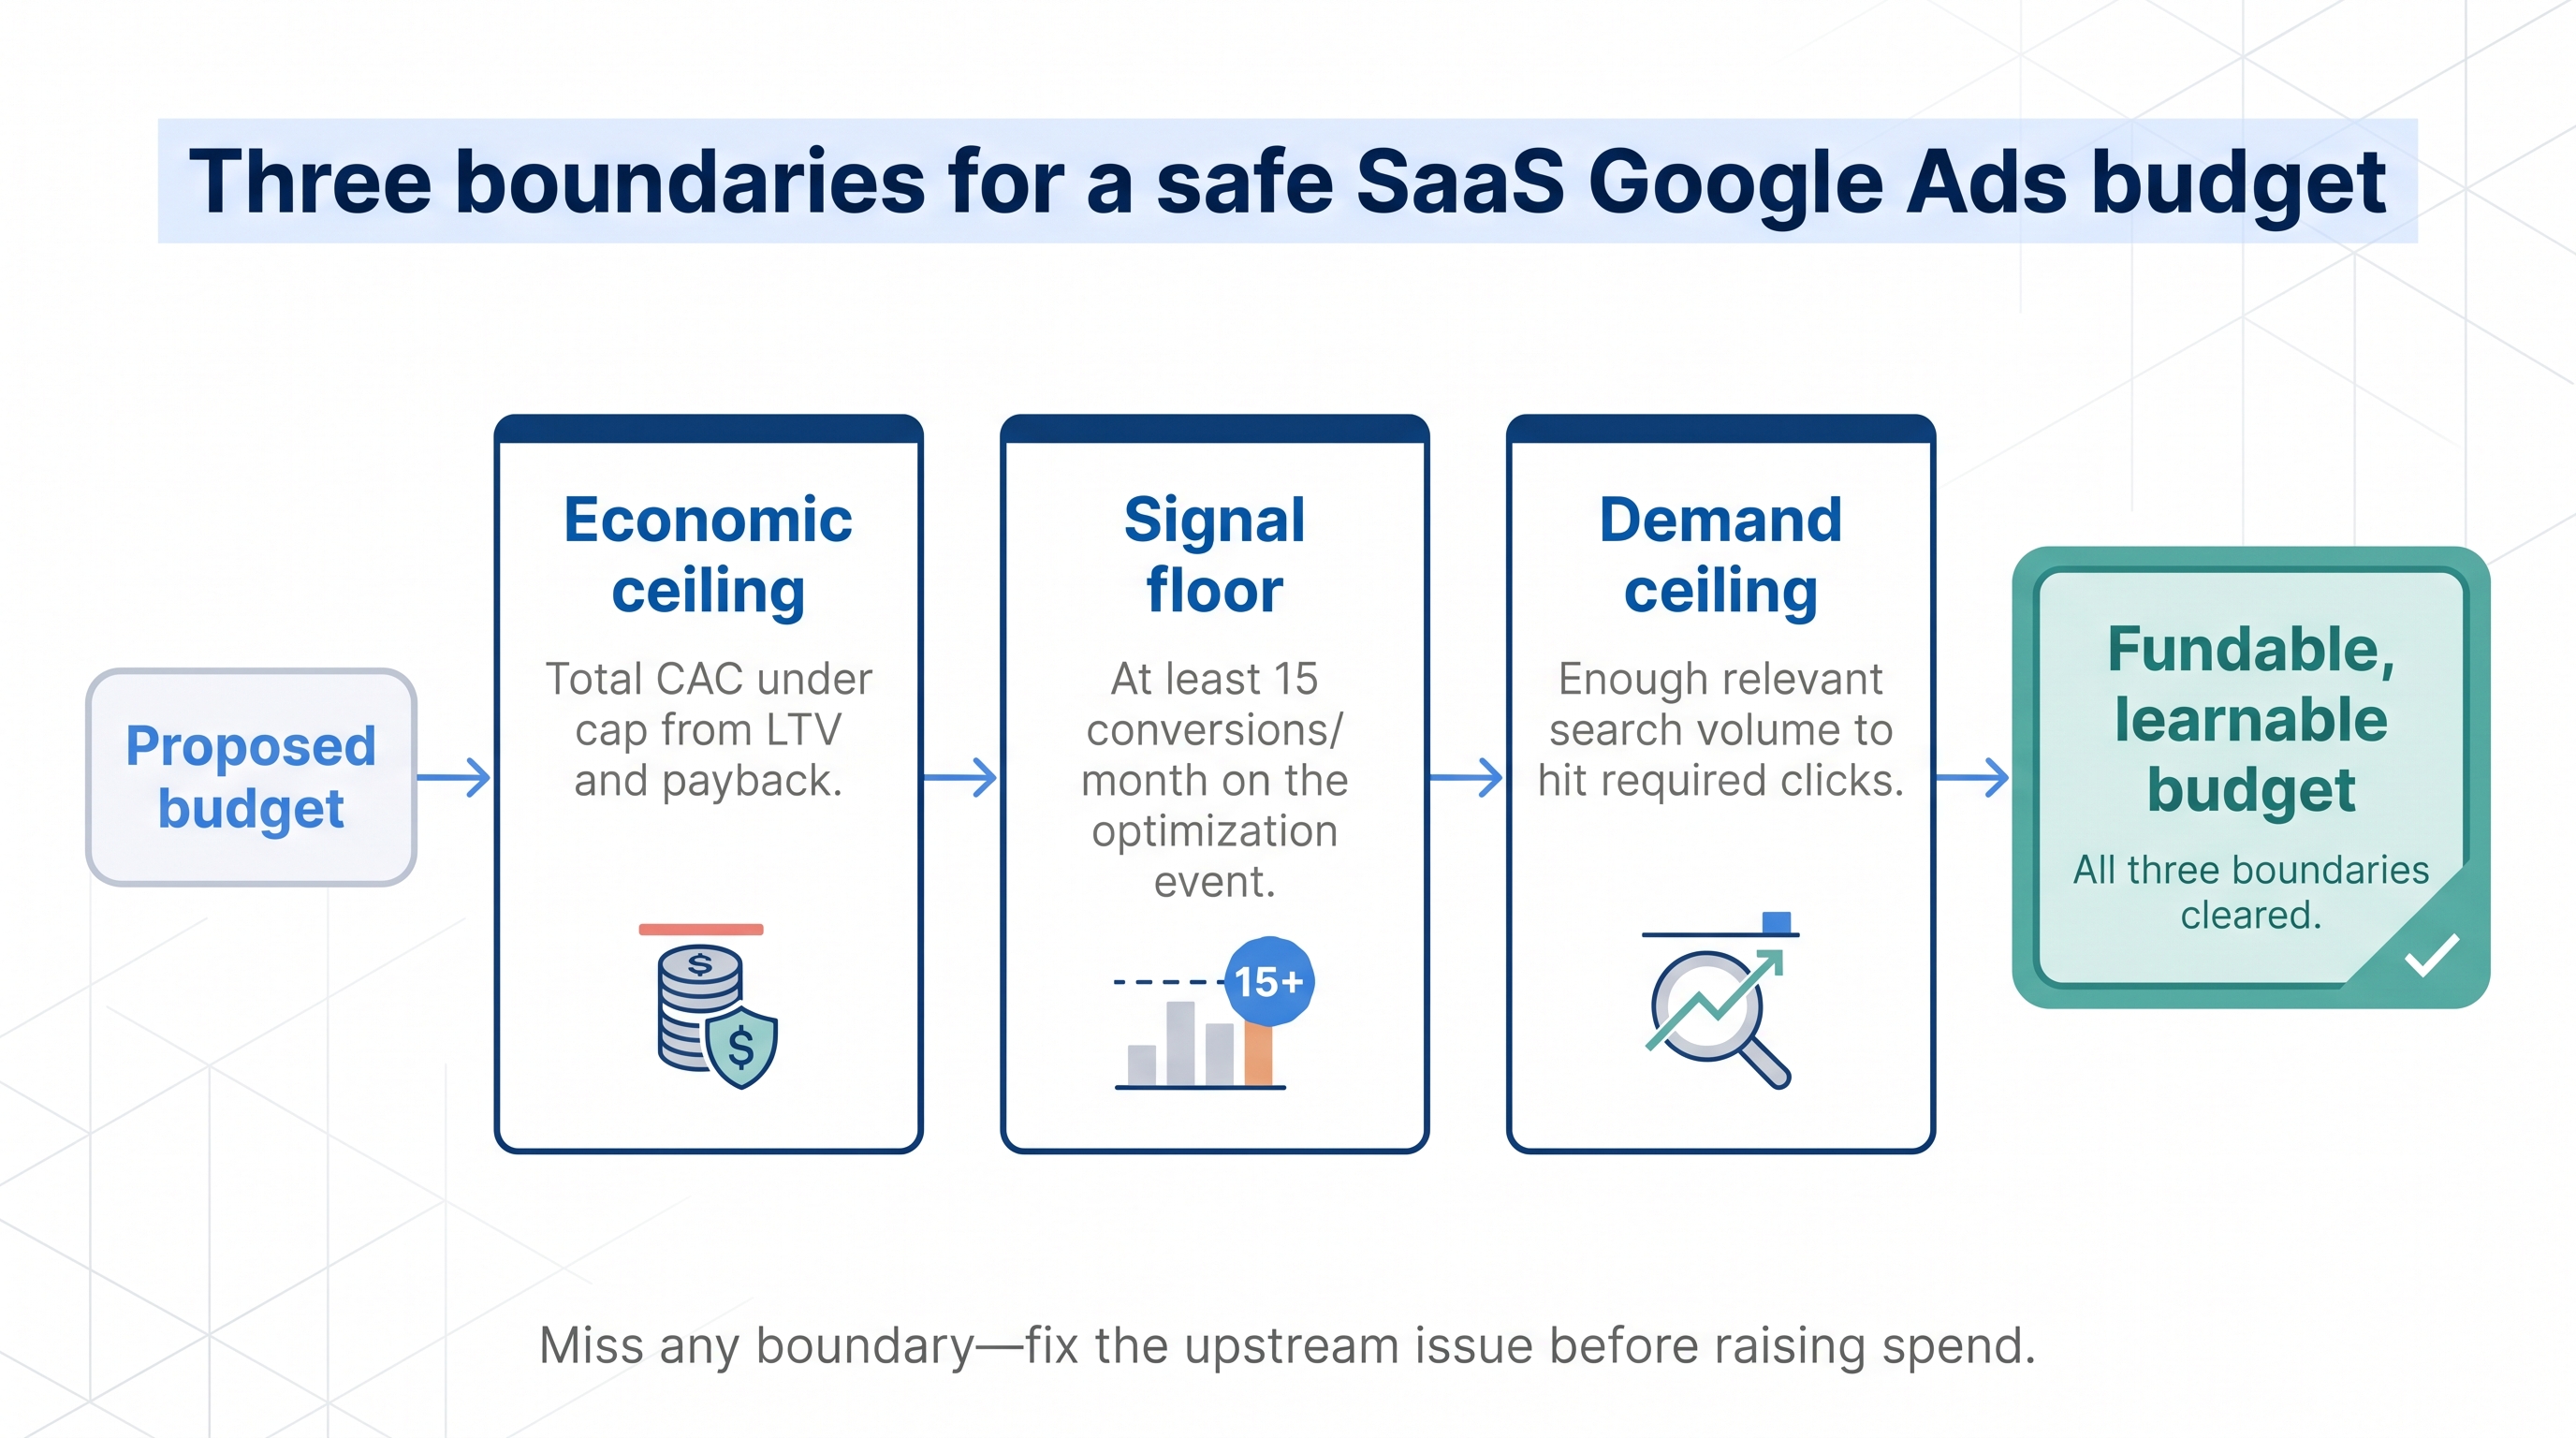
Boundary 1: the economic ceiling
Paid spend plus every non-media cost must fit under the CAC cap you calculated earlier. Treat that limit as non-negotiable. If forecast CPC rises or close rate falls, rerun the model and trim targets. Never raise the ceiling and hope profit catches up.
Boundary 2: the signal floor
Google’s value-based bidding guidance calls for at least 15 conversions in the last 30 days for Target ROAS on the optimisation event you feed the algorithm. Assign probability-weighted values to earlier milestones (qualified lead, activated trial) until closed-won volume is high enough to become the primary signal.
Boundary 3: the demand ceiling
Strong economics and clean signals still fail if the market cannot supply clicks. Keyword Planner or Performance Planner will show whether relevant non-brand queries can hit your required 375-click target. If forecast inventory tops out at 200 clicks:
- Accept fewer customers, or
- Add another channel, region or intent stage.
Raising budget alone will not create new searches.
Clear all three gates (profit, signal and demand) and your Google Ads budget for SaaS is both fundable and learnable. Miss any gate and fix the upstream issue before spending the next dollar.
Step 5: make Google optimise for LTV, not form fills
Connect CRM and product data
Google can only optimise for outcomes you supply. Use Enhanced Conversions for Leads or the newer Data Manager workflow to pass every qualified lead, activated trial, opportunity and closed-won event, each tagged with consent status and the original GCLID. When these deeper signals arrive daily, Smart Bidding has the raw material to chase revenue rather than shallow form submissions.
Assign probability-weighted values
Give each milestone a monetary value that matches its historical chance of becoming revenue:
Stage value = gross-margin LTV × probability of reaching closed-won
Example
Gross-margin LTV = $12,000
- Qualified lead with a 20 percent win rate ? $2,400
- Activated trial with a 35 percent win rate ? $4,200
Use Conversion Value Rules to boost bids for high-margin cohorts (for instance, U.S. mid-market accounts) without overpaying for low-value sign-ups.
Shift to value-based bidding when data supports it
Start with Maximise Conversions to collect clean, consistent signals. Once the account logs about 15 qualified-lead or converted-lead events per month, switch to Maximise Conversion Value or Target ROAS.
Set ROAS from the earlier LTV math. If gross-margin LTV is $12,000 and the paid-media CAC cap is $2,300, break-even ROAS equals $12,000 ÷ $2,300 ? 5.2x. Enter a target slightly below that, say 500 percent, to give Smart Bidding room to scale while staying inside the cap.
Avoid an unrealistically high target. Since Google’s August 17, 2026 update, budget-limited Target ROAS campaigns optimise more closely to the target you enter instead of beating it, even if that throttles volume.
Tying ROAS to lifetime value keeps every bid aligned with long-term profit, not short-term vanity metrics.
Step 6: scale on marginal CAC, not averages
Early wins do not guarantee efficient scale. Each incremental dollar often buys a pricier click, a colder lead or a market you know less about. Track marginal CAC, the cost of the next customer, rather than celebrating a blended historical average.
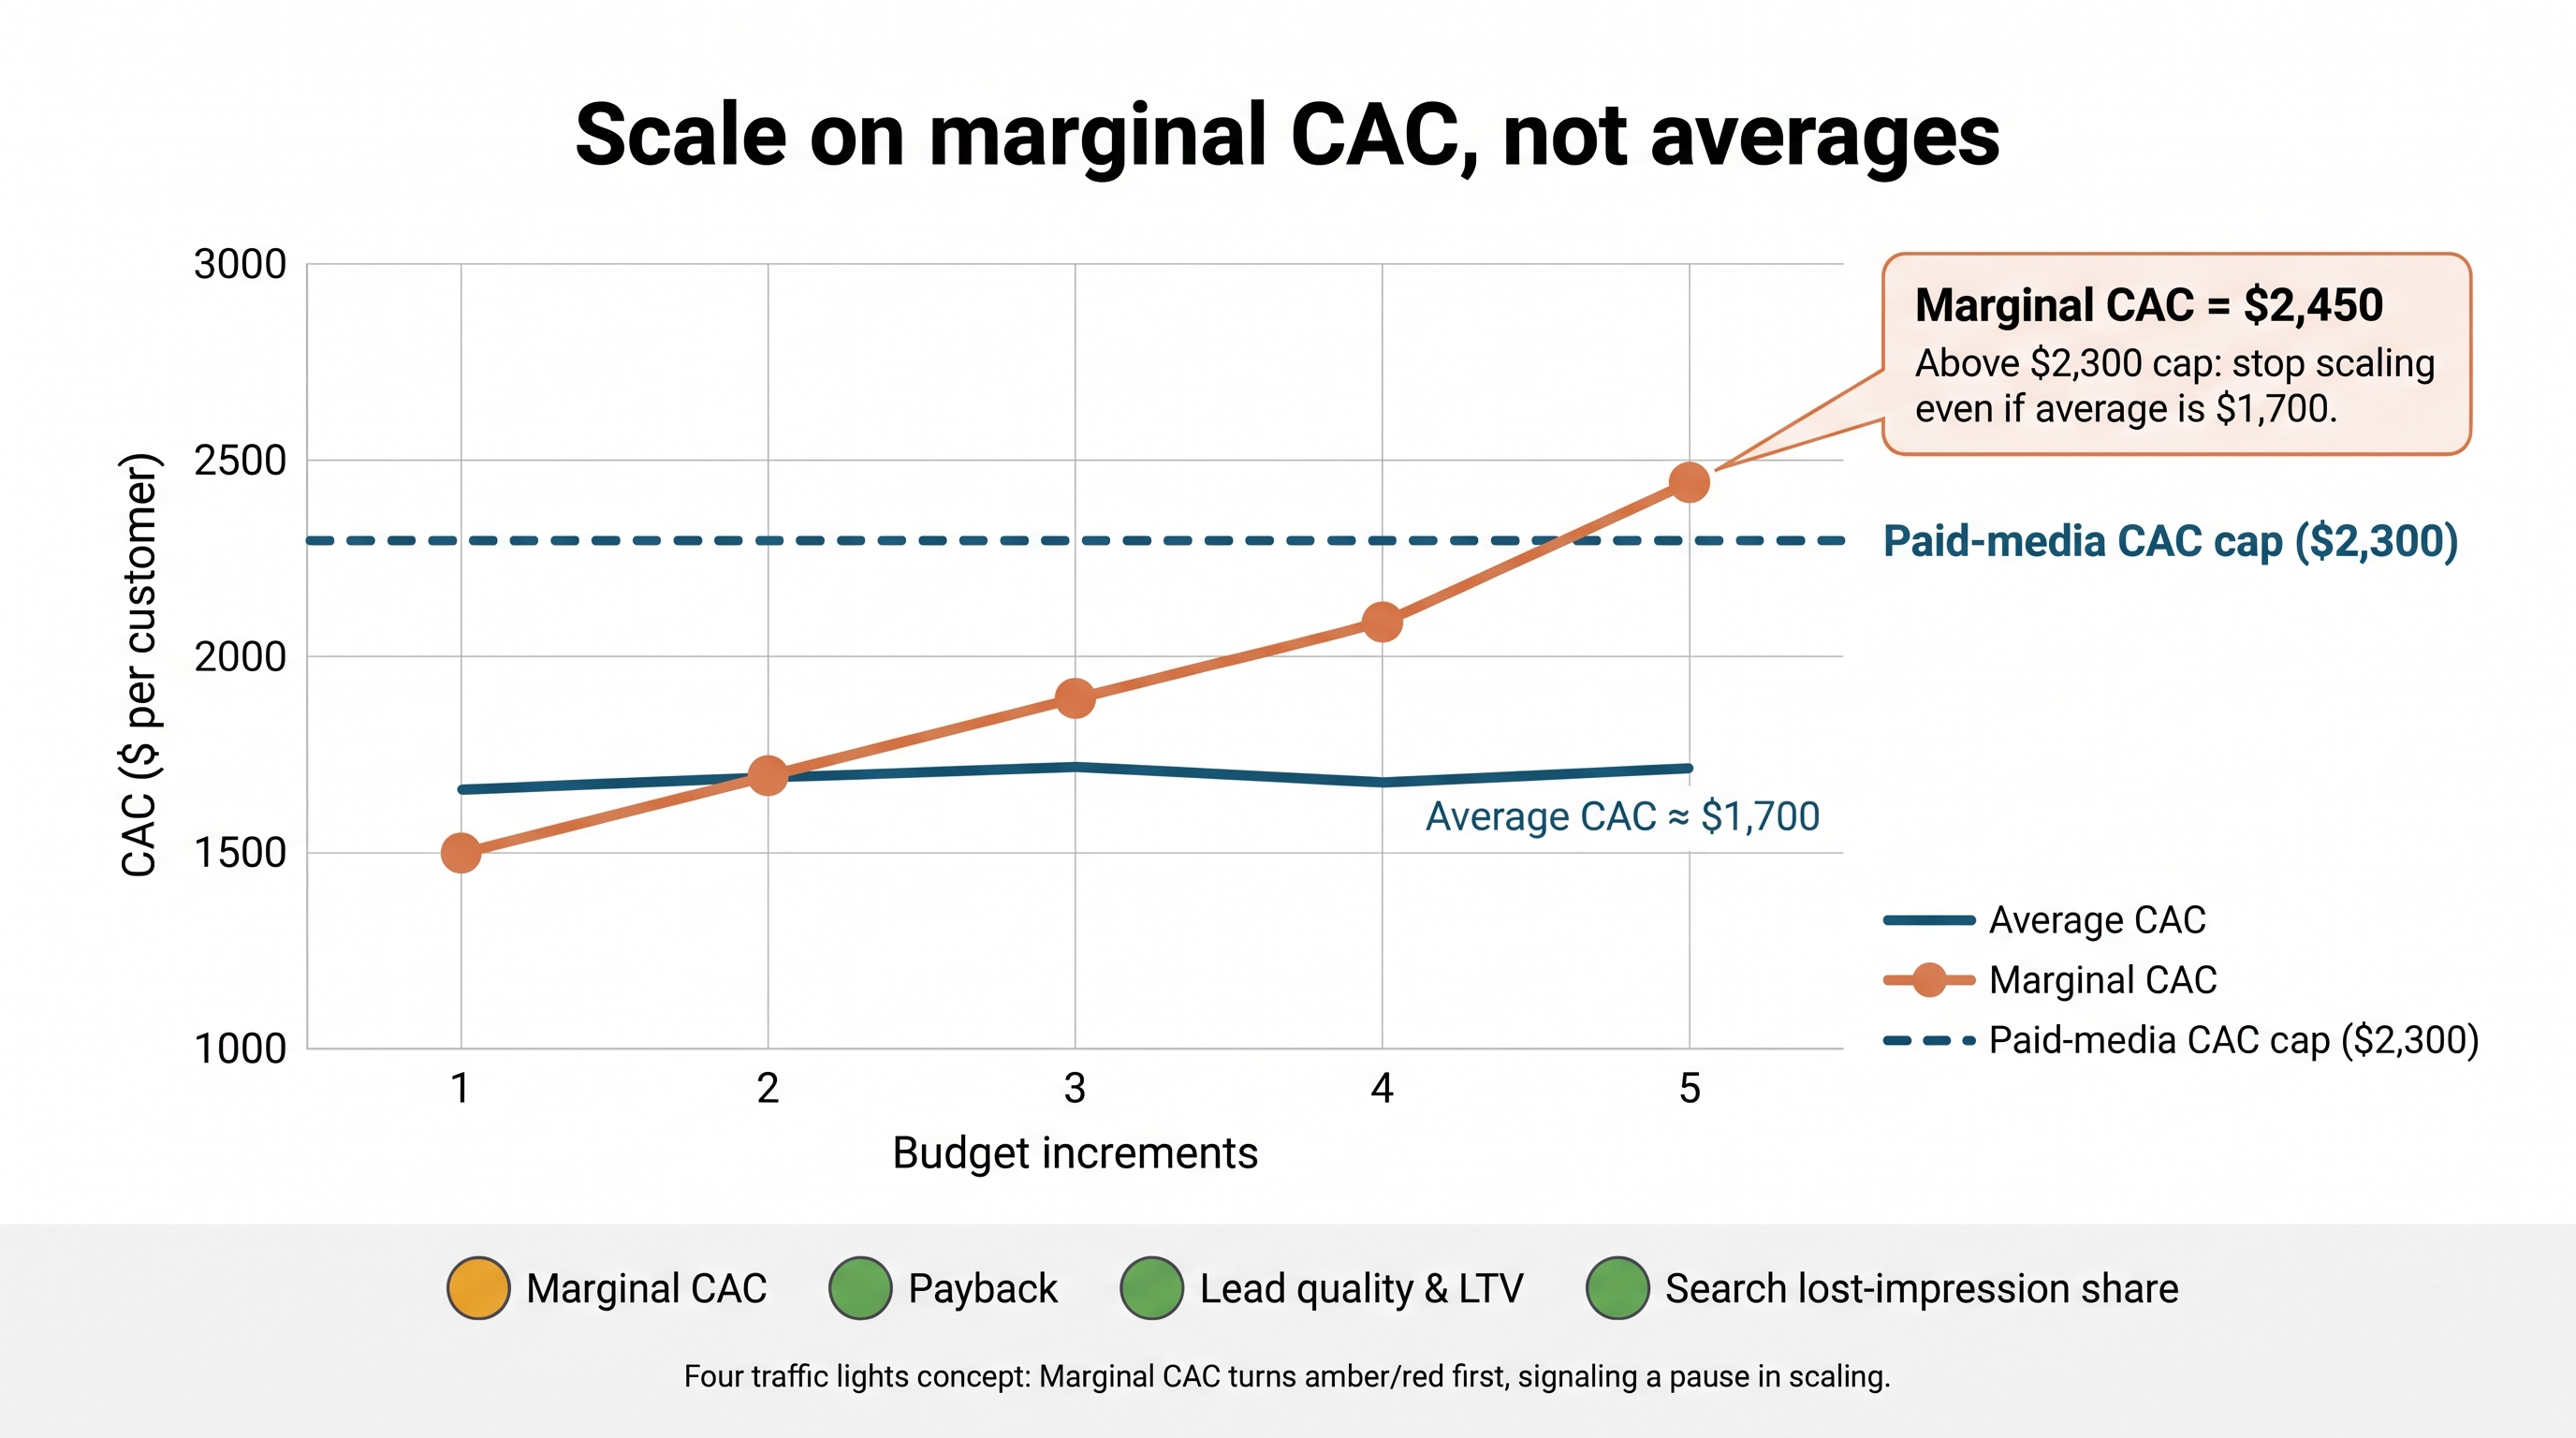
Increase budget only while all four traffic lights stay green:
- Marginal CAC remains below the paid-media cap.
- Payback still clears the finance team’s limit.
- Lead quality and cohort LTV hold steady.
- Search lost-impression share shows the campaign is budget-limited (for example, more than 20 percent lost because of budget, per Google Ads reporting).
Numeric snapshot
If the paid-media cap is $2,300 and marginal CAC on the latest increment rises from about $2,100 to $2,450, stop scaling even if the blended average sits at $1,700.
When any light turns amber, pause, diagnose and fix. Falling conversion rates may signal landing pages that collapse under heavier traffic; rising CPC can indicate that high-intent queries are exhausted and the campaign is drifting into vague territory. Scaling is a staircase: take one step, let performance stabilise, then climb again. Anchoring expansion to marginal economics keeps a Google Ads budget for SaaS both ambitious and disciplined.
For African SaaS teams: localise the inputs before the budget
Exchange-rate swings and connectivity gaps can turn a spreadsheet win into a cash-flow loss. The Nigerian naira, for instance, has lost more than 80 percent of its value against the US dollar since the 2016 float (about ?197 to the dollar before it, about ?1,350 in November 2026), creating severe exchange-rate risk for dollar-denominated ad spend. Median mobile download speeds in Nigeria sat around 43 Mbps in September 2026 (Ookla Speedtest Global Index), ranking 85th in the world.
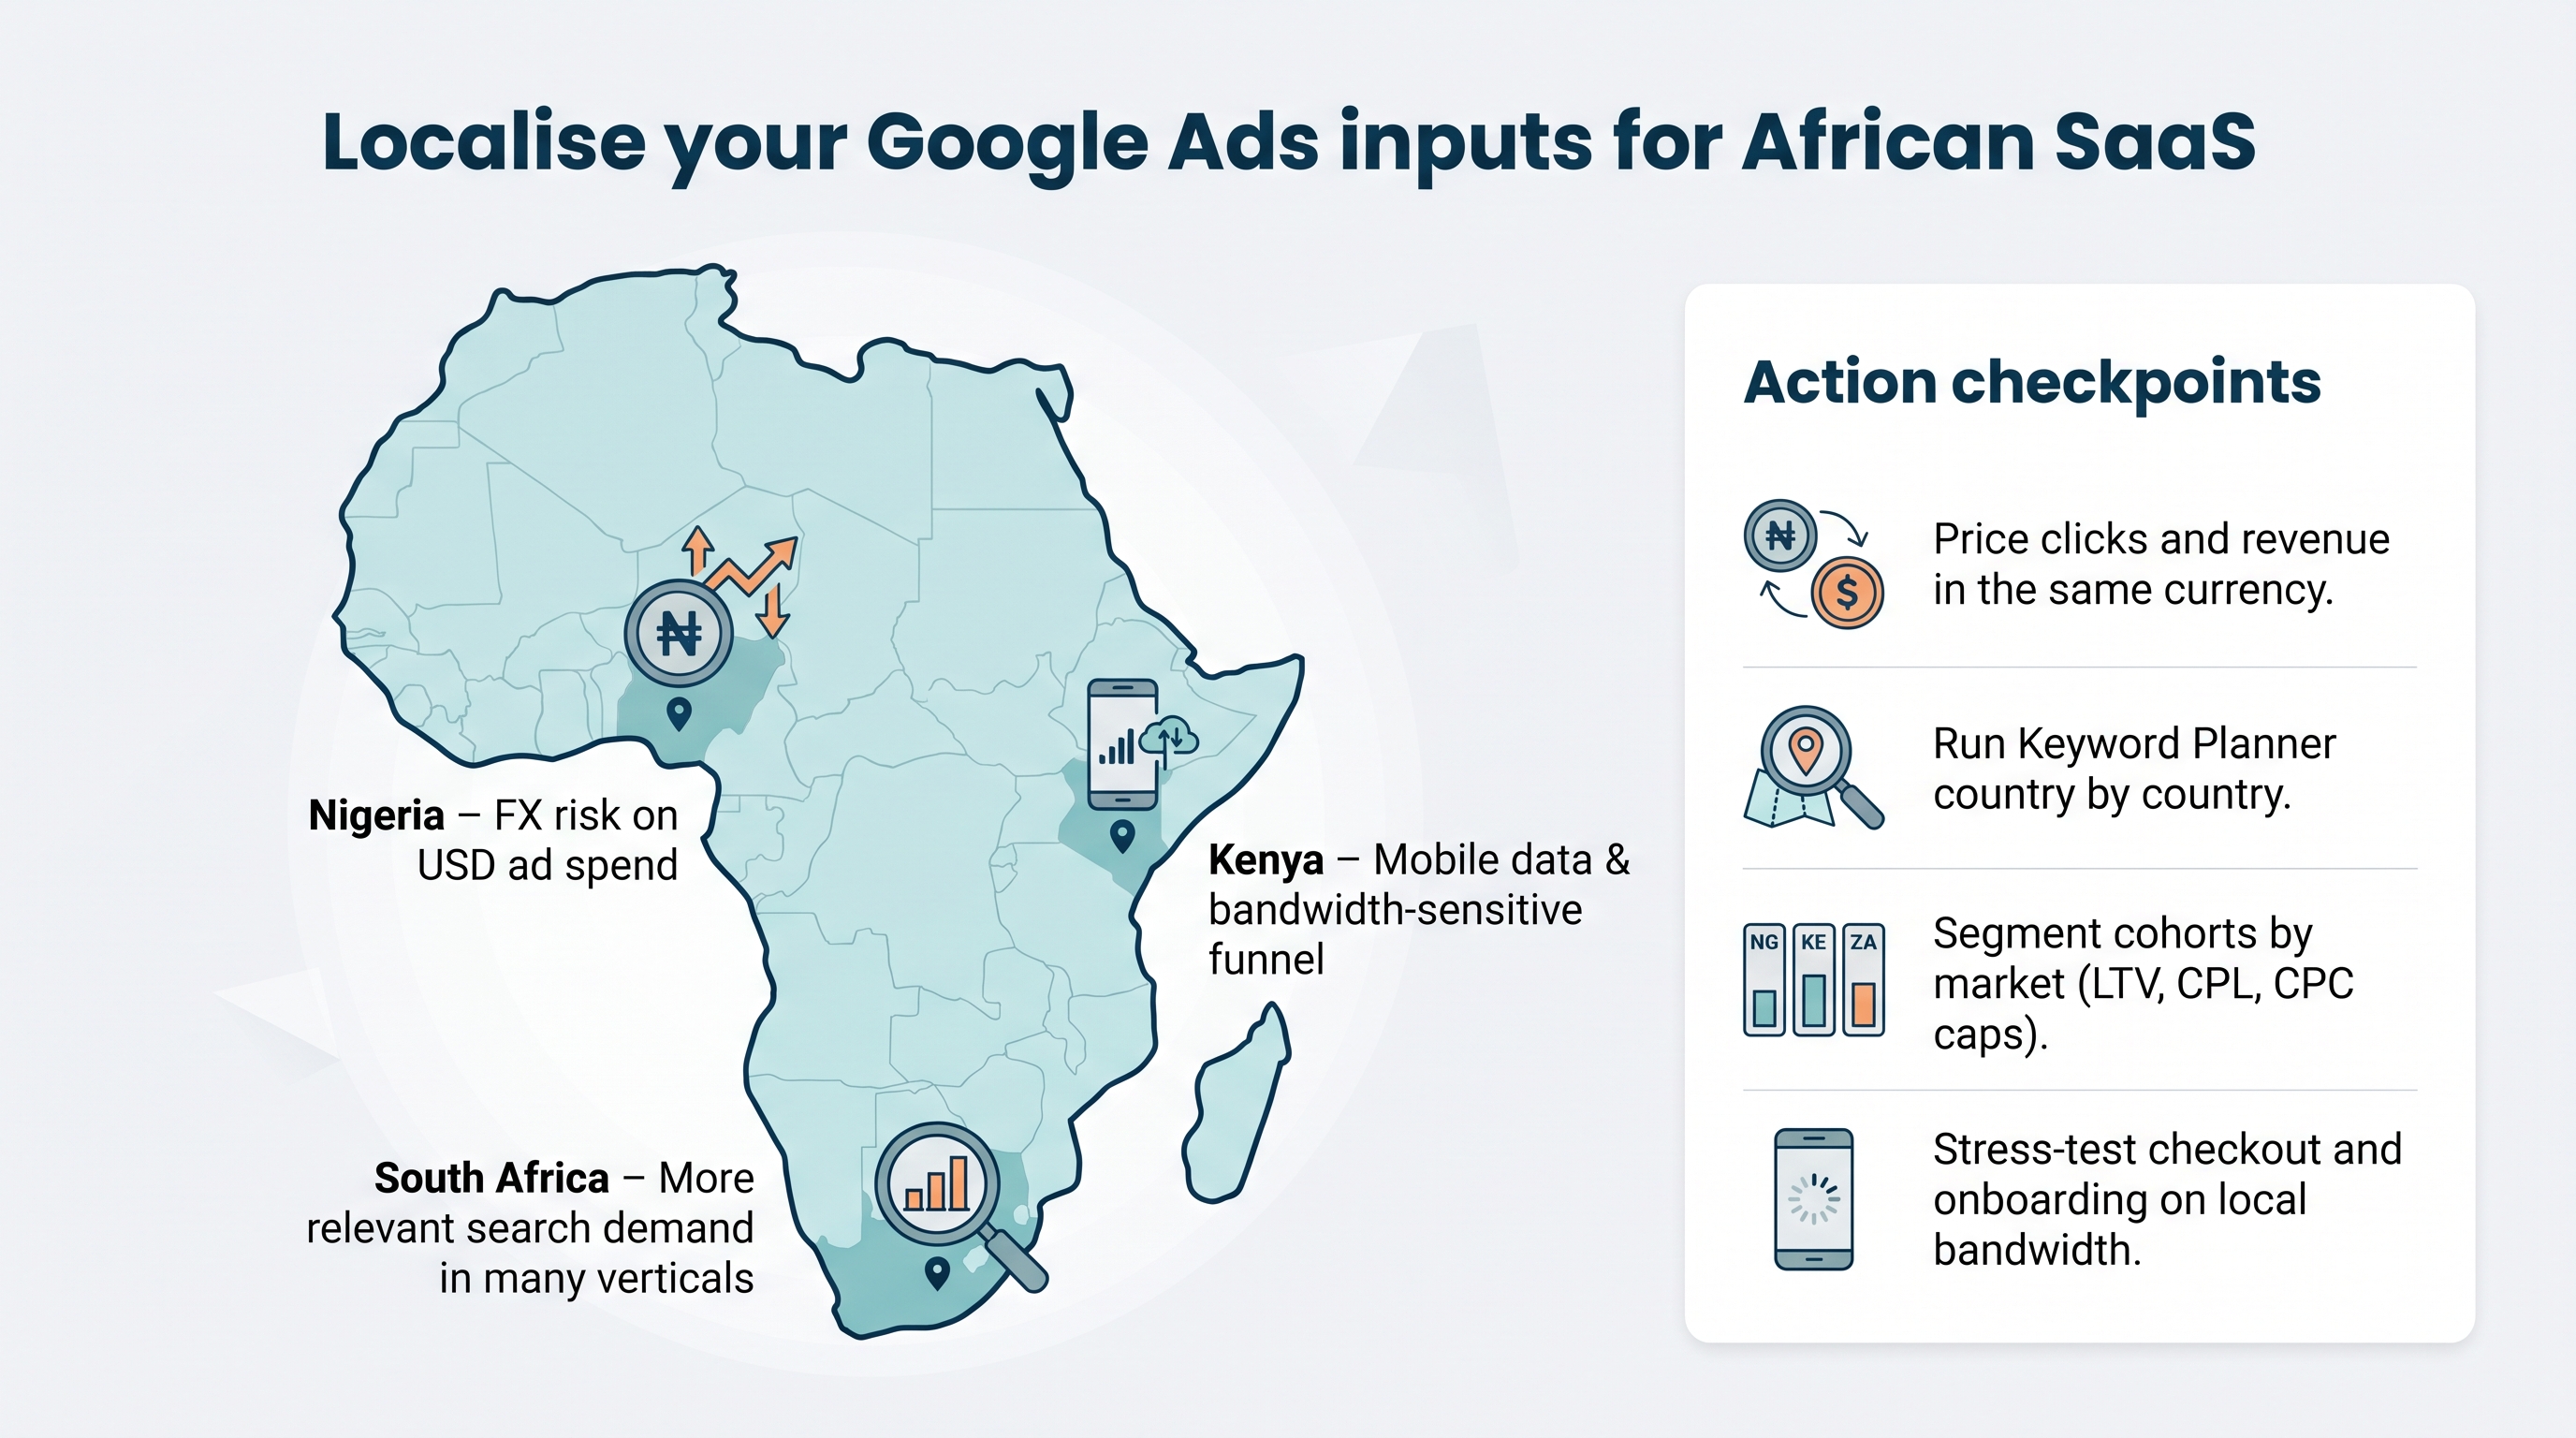
Action checkpoints for any Google Ads budget that targets Africa:
- Price clicks and revenue in the same currency. Converting naira-denominated ad costs into United States dollar MRR after the fact can hide a real swing in payback.
- Run Keyword Planner country by country. Search volume for the same B2B category can differ sharply between Nigeria, South Africa and the United States, so blending them inflates demand forecasts.
- Segment cohorts by market. A self-serve Kenyan user on prepaid mobile data will not retain or expand like a German enterprise contract. Feed market-level LTV, CPL and CPC caps back into Google Ads through value rules.
- Stress-test checkout and onboarding on local bandwidth. A page that loads fast on a US connection can load much slower on congested mobile networks, eroding conversion and raising marginal CAC.
Localising these inputs keeps the budget anchored to real profit instead of optimistic averages.
Conclusion: the budget is an output, not an input
A Google Ads budget for SaaS companies should never be a convenient round number. Start with cohort-level gross-margin LTV, apply CAC and payback ceilings, confirm alignment across profit, signal and demand, then let first-party values teach Smart Bidding to chase lifetime revenue. Follow the chain: value, cap, funnel math, boundaries and marginal scale. When each link holds, the right budget reveals itself month after month.