Understanding market movements often comes down to one thing: price action. And candlestick patterns are the most important part of price action analysis. These visual clues assist traders in determining whether to enter or leave a transaction by providing them with information about potential value shifts.
One of the best first things you can do if you’re new to trading is to learn these fundamental patterns. Ten of the most dependable and often used candlestick patterns are covered below in this trading guide; they are stated simply and without filler. Every beginner should be familiar with them.
What Are Candlesticks and Why Do They Matter?
A candlestick chart displays the price’s movement over a certain time period. With its four data points — open, close, high, and low — each candle tells a tale. The wicks, or shadows, of the candle represent the high and low points, while the body of the candle represents the open and close range. The color — typically green or red — reveals direction.
Patterns form when one or more candles appear in a recognizable arrangement. Traders use them to anticipate reversals, continuations, or consolidation zones. Learning to read these signals helps sharpen timing and reduce guesswork.
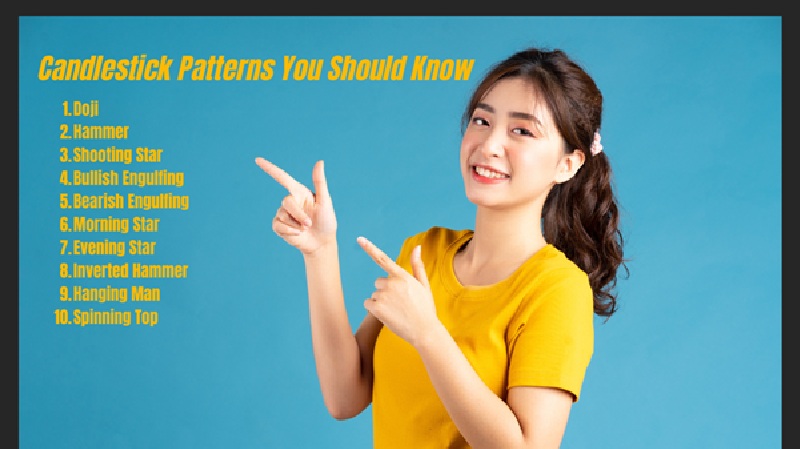
1. Doji
A small or non-existent body with long upper and lower wicks.
A Doji signals indecision. Buyers and sellers push prices in both directions, but end near where they started. It often appears before a trend change or slowdown.
Look for it after strong trends. Alone, it’s not a trade signal. Used with volume or other indicators, it can confirm weakening momentum.
Misinterpreting a Doji in a sideways market — it’s less meaningful without a trend.
2. Hammer
A small body at the top, with a long lower wick at least twice the length of the body.
A Hammer shows buyers stepping in after sellers drove the price down. This pattern suggests a potential bullish reversal.
Appears after a downtrend. Confirmation from the next candle closing higher strengthens the signal.
Ignoring volume. Low-volume hammers are often weak signals.
3. Shooting Star
Small body near the bottom, long upper wick.
This pattern shows a failed bullish move. Buyers pushed the price high, but sellers took over by the close.
Appears at the top of an uptrend and suggests a possible bearish reversal.
Entering short too early. Wait for confirmation with a lower close.
4. Bullish Engulfing
A large green candle fully engulfs the previous small red candle.
Buyers overwhelmed sellers and regained control. Strong bullish signal.
Ideal after a downtrend or near support levels.
Trading without checking for nearby resistance. Always consider the context.
5. Bearish Engulfing
A large red candle fully engulfs a smaller green candle.
Sellers stepped in aggressively and reversed buyer strength.
Watch for this at the end of an uptrend or near resistance.
Jumping in without confirming momentum or trend exhaustion.
6. Morning Star
Three candles: bearish, small-bodied (indecision), bullish.
Marks a reversal from bearish to bullish sentiment. The middle candle shows hesitation, and the third confirms a shift.
After a decline, especially near a key support level.
Ignoring the size of the third candle. A weak finish weakens the signal.
7. Evening Star
Bearish version of the Morning Star.
Signals a likely top. The first candle is strong and bullish, the second is indecisive, the third is bearish, and closes into the first.
After a rally, especially near resistance zones or overbought levels.
Overlooking volume drop-off or divergence with indicators like the Relative Strength Index (RSI).
8. Inverted Hammer
Small body at the bottom, long upper wick.
After a downtrend, buyers show initial strength but don’t close high. Still, it may suggest a trend shift.
Look for it near the bottom zones. Needs confirmation from the next bullish candle.
Treating it as a standalone buy signal.
9. Hanging Man
Same shape as the Hammer, but found after an uptrend.
Shows that sellers are starting to gain ground despite the bullish trend.
Signals caution or potential reversal near market tops.
Using it in isolation. Wait for bearish confirmation.
10. Spinning Top
Small body, upper and lower wicks of similar length.
The market is uncertain. Neither buyers nor sellers dominate.
Useful when spotted after a sharp move. Indicates pause or potential reversal.
Relying too heavily on it. It’s a neutral signal and needs more context.
How Should Beginners Use These Patterns?
Understanding candlestick shapes is one thing. Using them effectively is another. Here are some key principles:
| Principle |
Explanation |
| Confirm with other tools |
Candlestick patterns rarely work well in isolation. You need confirmation from technical tools to improve accuracy. For example, if volume increases and a Bullish Engulfing appears at support, the bounce likelihood is stronger. Indicators such as the Relative Strength Index can show overbought or oversold zones. Patterns that align with trendlines, moving averages, or confluence areas carry greater credibility and help reduce false signals. |
| Stick to clean trends |
Patterns carry more weight in trending markets. A Shooting Star during a strong uptrend is meaningful, while the same pattern in consolidation often misleads. Ranging markets tend to produce noise and false signals. Before acting on a pattern, confirm if the market is trending or consolidating. Clear moves create stronger signals, while choppy moves increase uncertainty. |
| Look for clusters |
A single candlestick may suggest a move, but multiple patterns near the same price area strengthen the case. For example, a Hammer followed by a Bullish Engulfing at support provides aligned signals. Clusters reflect consistent buyer or seller behavior. Patterns that appear near key levels — previous highs/lows or Fibonacci retracements — tend to be more reliable. |
Where Can You Learn More and Practice With Real Examples?
Candlestick formations are not limited to one market. They appear consistently in equities, forex, commodities, and even crypto charts, since all rely on human psychology reflected in price. If you’re serious about mastering these, practicing on real charts is essential. Reading about them is only half the journey. The other half is about observation, pattern recognition, and timing.
Some professional educational platforms do a great job supporting new and developing traders. They often provide structured lessons, backtesting guides, and visual tools. Many include printable study aids like a candlestick patterns PDF, some kind of a cheat sheet, in their resource libraries. These PDFs summarize patterns visually, helping you internalize them faster and more clearly.
When a learning environment prioritizes clarity and practical tools, you’ll find yourself progressing faster and with more confidence.
Final Thoughts
Every trader starts somewhere, and learning these chart patterns is a step in the right direction. Each one offers a glimpse into market psychology and helps improve timing. Used with proper context and discipline, they can give you a real edge in the market, ready to spot your first pattern on a live chart today.
https://drive.google.com/file/d/1Mc9cl1GHVEhcDosJGZLPljEy9mRARgMZ/view?usp=drive_link
https://drive.google.com/file/d/1tyae4HBU__OLCzl_7wZ5SRFLysydvF9C/view?usp=drive_link
https://drive.google.com/file/d/1M7sDU0hySHEJchNdU3MzpgYUvtM2zW7k/view?usp=drive_link
Like this:
Like Loading...


