DD
MM
YYYY

PAGES

DD
MM
YYYY

spot_img

PAGES

Home Blog Page 23

Polymarket Projects 81% as Chances for a U.S Government Shutdown

0

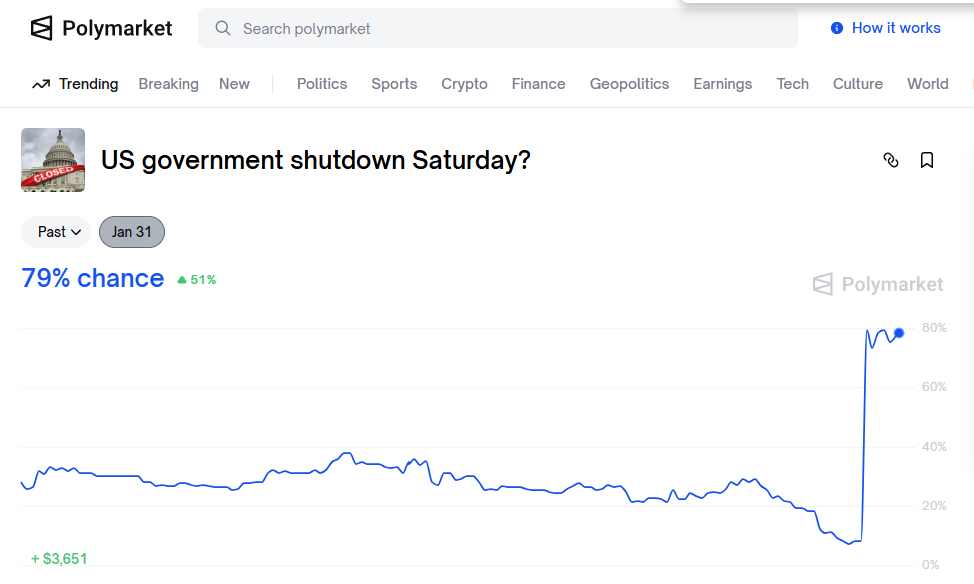
The odds of another US government shutdown occurring by January 31, 2026, have surged on Polymarket, currently standing at 81% for “Yes” on that outcome.

This represents a sharp increase from lower probabilities just days ago, such as around 9-11% late last week, as reported across multiple sources. The spike aligns with recent political developments, where Senate Democrats, led by Minority Leader Chuck Schumer, announced they would withhold votes to advance a government funding package if it includes funding for the Department of Homeland Security (DHS).

This stance follows a fatal shooting in Minneapolis involving federal agents, reportedly from Border Patrol or ICE, which has intensified Democratic calls for changes to DHS provisions, including restrictions on ICE funding.

Government funding is set to expire at the end of this week (January 31), and without bipartisan agreement, a partial shutdown could affect non-essential federal operations, though essential services like Social Security and military pay would continue.

Republicans have pushed back, framing any potential shutdown as a “Schumer shutdown” due to Democratic opposition, while emphasizing the need for uninterrupted funding to support ongoing efficiency reforms like those from the DOGE initiative.

Discussions on platforms like X highlight trader sentiment, with some estimating even higher odds up to 85% based on the impasse over DHS reforms. Similar prediction markets like Kalshi show comparable jumps, reaching 79%.

Market reactions could influence stocks, particularly in sectors tied to government contracts, though historical shutdowns like those in 2018-2019 have often had limited long-term economic impact. Negotiations are ongoing, with senators like Chris Murphy and Tim Kaine seeking amendments, but resolution remains uncertain as the deadline approaches.

Government shutdowns in the United States have occurred periodically since the 1980s, stemming from failures to pass funding legislation, often due to partisan disputes over spending or policy riders.


Prior to that era, funding gaps rarely disrupted operations, as agencies continued functioning under the assumption of eventual appropriations. Since 1977, there have been about 20 such events, with an average duration of eight days, though some have lasted weeks or months.

Notable historical shutdowns include: 1995-1996: Two separate closures under President Clinton and a Republican-led Congress, totaling 26 days, triggered by disagreements over budget cuts and Medicare reforms.

Impacts included delayed passport processing, closed national parks, and halted toxic waste cleanups, affecting millions.

2013: A 16-day shutdown during the Obama administration over Affordable Care Act funding, leading to furloughs of 800,000 federal workers and economic losses estimated at $24 billion.

2018-2019: The longest on record at 35 days under President Trump, centered on border wall funding disputes. It reduced U.S. economic output by $11 billion over the following quarters, with ripple effects on contractors and small businesses.

Economic impacts have varied but are generally short-term and disruptive. Shutdowns have caused losses in tourism e.g., closed national parks costing millions daily  aviation delays due to understaffed TSA and FAA operations, and halted government contracts, leading to broader supply chain issues.

This changes in minutes at Polymarket

The 2018-2019 event alone resulted in $3 billion in permanent losses after accounting for back pay and recoveries. Additionally, they delay economic data releases from the Bureau of Labor Statistics, complicating market predictions and policy decisions.

Federal workers bear significant burdens: During shutdowns, non-essential employees often hundreds of thousands are furloughed without pay, while essential staff e.g., in law enforcement or air traffic control work unpaid until resolution.

Congress typically approves back pay afterward, but the interim financial strain leads to missed bills, depleted savings, and reliance on food banks or loans. Public services face interruptions, including delayed Social Security verifications, suspended FDA inspections, halted IRS audits, and paused research grants.

Vulnerable populations, such as those on food assistance or housing subsidies, experience payment delays, exacerbating hardship. National security can be affected through reduced military training or border operations, though core defenses continue.

Financial markets have historically shown resilience, with limited long-term effects on stock prices or bond yields, as investors view shutdowns as temporary political theater.

However, short-term volatility can occur, particularly in sectors reliant on government spending, like defense or healthcare. While shutdowns impose real costs—estimated in the billions—they rarely lead to structural changes in government size or function.


Bitcoin Struggles Below Key Resistance Point as Bearish Momentum Tightens Grip

0

Bitcoin remains under pressure as it struggles to reclaim key resistance levels, with bearish momentum continuing to dominate price action. The crypto asset experienced modest volatility around Tuesday’s Wall Street open, briefly climbing to $88,315 before retracing lower.

The price action reflects a cautious market environment as investors position ahead of the U.S. Federal Reserve’s next interest rate decision, amid a crowded backdrop of macroeconomic and political risks.

After reaching a year-to-date high near $98,000 earlier in the year, Bitcoin has remained on a downward trajectory, signaling that sellers continue to dominate market structure. With key resistance levels holding firm and momentum skewed to the downside, traders are increasingly focused on where price could head next if selling pressure persists.

Crypto analyst Crypto Patel noted in a recent post on X that Bitcoin has firmly rejected the $94,000–$98,000 neckline resistance zone, reinforcing a bearish technical structure. According to Patel, this rejection confirms that sellers remain in control, as the failure to reclaim this region has prevented any meaningful shift in momentum.

From a technical perspective, Patel highlighted that Bitcoin has completed a failed Head and Shoulders pattern, followed by a bear-flag breakdown. This sequence strengthens the bearish case, with price action continuing to print lower highs while struggling beneath major resistance.

As long as Bitcoin remains capped below the neckline, the broader trend remains decisively bearish. Patel added that a bullish bias would only return if BTC manages a strong reclaim and sustained acceptance above $92,000. Until then, rallies are likely to be viewed as selling opportunities rather than indications of a trend reversal.

Market sentiment has also been shaped by broader macro developments. Gracie Lin, CEO of OKX Singapore, observed that markets have become increasingly headline-sensitive as multiple risks converge. With gold posting fresh highs and investors digesting political and regulatory uncertainty, she noted that Bitcoin is likely to remain range-bound and volatile in the near term. According to Lin, price action may be influenced less by the Fed’s decision itself and more by evolving liquidity conditions and overall risk appetite.

Speculative sentiment is also visible on prediction markets. On Polymarket, a contract running through the end of the week has recorded nearly $67 million in trading volume tied to Bitcoin’s price by the end of January. The majority of participants are betting on further downside, with $85,000 emerging as the most favored potential low. In contrast, longer-term sentiment appears more constructive. In a separate Polymarket contract with over $9.3 million in volume, most bettors predict Bitcoin will reach $100,000 before year-end.

Since slipping below $90,000, Bitcoin has struggled to reclaim higher levels, a dynamic that has weighed on the broader crypto market. Ethereum remains capped below $3,000, BNB below $900, Cardano trades around $0.35, and Dogecoin hovers near $0.122. Despite this, select altcoins have shown notable relative strength, sparking renewed discussion around a potential Altseason. However, on-chain data suggests that while altcoins may be approaching a structural turning point, the market is not yet in a clear comfort zone.

Outlook

In the near term, Bitcoin’s trajectory remains tilted to the downside unless buyers can reclaim and hold above the $92,000 level. A sustained move below current support could open the door to a test of the $85,000 region, which is increasingly seen as a key downside target.

Conversely, a decisive break back above resistance would be required to invalidate the prevailing bearish structure. Until clearer signals emerge, Bitcoin is likely to remain volatile, with macro developments, liquidity conditions, and shifting risk sentiment continuing to dictate price action across the broader crypto market.

AI Not the Main Pillar of U.S. Economy in 2025, Macro Report Finds, Tempering Bubble Fears

0

Despite the headlines, hype, and multi-trillion-dollar valuations tied to artificial intelligence, a new economic report suggests that AI was far from the dominant force that drove U.S. growth in 2025.

While AI investment captured investor attention and reshaped corporate priorities, the economy’s real backbone remained household spending, imports-adjusted domestic investment, and traditional drivers of consumption.

Macro Research Board Partners, an economic research platform, published the report in January, authored by strategist Prajakta Bhide. The research directly challenges the popular narrative that the U.S. economy’s growth is narrowly concentrated in AI and thus highly vulnerable to a sector-specific downturn.

“In short, without an AI boom, there would have certainly been less GDP growth last year, but there would also have been fewer imports, so that overall real growth would still have been decent,” Bhide wrote.

Consumers Remain the True Engine of Growth

Personal consumption — spending by households — remained the primary driver of GDP in 2025, even as aggregate income growth slowed and job gains remained modest. “Consumers continue to be the backbone of the economy,” Bhide told Business Insider. “There is a divide between what consumers say they feel and what they say that they’re going to do versus what they actually go and do.”

Despite cautious sentiment, households continued to spend, helping sustain overall economic growth.

This distinction is important because much of the AI-driven investment surge is in imported hardware, including high-performance computing chips, servers, networking equipment, and specialized data-center infrastructure. While these expenditures are significant, they do not directly add to GDP. After adjusting for imports, AI’s contribution to growth is substantially smaller than market perception might suggest.

AI as a Secondary, Not Primary, Driver

The report emphasizes that AI contributed to GDP mostly through software development, cloud-based services, and other domestic investment, while the physical infrastructure side — data centers, imported servers, fiber-optic networks, and GPUs — had a negligible net contribution to GDP.

“Although a negative shock to the optimism around AI implies a risk to GDP growth,” Bhide wrote, “the more realistic (and smaller) estimate of AI’s growth impact after adjusting for imports dispels the popular notion that the U.S. economy would falter without it.”

Historically, recessions are rarely triggered by a pullback in consumer spending before job losses occur. Business Insider has noted that consumer spending tends to weaken after economic downturns take hold, suggesting that fears of an AI-induced collapse might overstate the risk.

Corporate and Market Implications

The report also indirectly touches on stock-market dynamics. The U.S. tech giants driving the AI hype — including Nvidia, Alphabet, Microsoft, Amazon, and Apple — are collectively valued at roughly $22 trillion. Much of the perceived economic risk associated with AI is linked to market volatility in these companies rather than a direct GDP effect. Analysts have noted that even if AI-related enthusiasm were to cool sharply, the broader economy is unlikely to collapse, given the deep, stable reliance on consumer spending and diversified corporate investments.

Bhide’s analysis also highlights the structural difference between AI investment and traditional GDP contributors. While AI spending can be large, it is concentrated among a handful of firms and sectors, creating what she calls “narrowly concentrated” growth. By contrast, personal consumption spans nearly all households, making it far less volatile as an economic stabilizer.

The findings also carry important implications for policymakers and investors. While government and private investment in AI remains strategically important, supporting national competitiveness, technological leadership, and high-value job creation, fears that AI alone underpins U.S. economic growth appear overstated. Infrastructure investment in AI and advanced computing will continue to reshape industry, but the economy’s resilience remains anchored in everyday consumer behavior.

Moreover, understanding the limited GDP contribution of imported hardware helps clarify the economic trade-offs of AI investment. Trillions of dollars may flow into advanced equipment, but the direct domestic contribution is modest until associated services, software, and manufacturing are scaled. The report suggests that a recalibration of expectations around AI’s macroeconomic impact may be warranted, with consumer spending continuing to play a leading role in sustaining U.S. growth.

While AI’s transformative potential in sectors from cloud computing to autonomous systems is undeniable, Bhide’s report makes it clear that the U.S. economy is not precariously balanced on algorithms and data centers. Consumers remained the true engine of growth in 2025, and AI’s GDP impact, though meaningful, was secondary.

The real risk from an AI slowdown lies more in financial markets and investor sentiment than in the underlying economy. The report’s findings suggest that even if the AI hype bubble were to deflate, the broader economy would likely continue to grow, albeit at a more measured pace. Policymakers, investors, and corporate leaders would be wise to distinguish between AI-driven market excitement and the fundamental drivers of economic resilience.

Coinbase Completes Solana DEX Integration As Coinbase Releases Post-Quantum Roadmap

0

Coinbase has fully rolled out its integration with the Solana blockchain, enabling users to trade millions of Solana-based tokens directly within the Coinbase app via its built-in decentralized exchange (DEX) functionality.

This doesn’t require official centralized listings on Coinbase’s exchange—instead, it leverages Solana’s leading DEX aggregator, Jupiter, to handle routing and execution across various Solana DEXs for seamless swaps. Tokens become tradable almost immediately after launching on Solana (or Base), with no extra setup needed for projects.

The integration expands access to a massive number of tokens often cited in the millions and taps into Solana’s high-speed, low-cost ecosystem. It’s live for users in supported regions like the US excluding New York in some reports and Brazil, with phased global rollout.

Coinbase CEO Brian Armstrong highlighted the completion reaching “100%”, emphasizing faster trading, broader token access, and improved user experience. This move positions Coinbase more as an “everything app” for crypto, bridging custodial services with on-chain DeFi trading and boosting Solana’s visibility among mainstream users.

Coinbase Releases Post-Quantum Roadmap

Coinbase has outlined and is actively advancing a comprehensive post-quantum security roadmap to prepare for potential threats from quantum computing, which could eventually break current cryptographic algorithms used in blockchains.

A major recent step includes establishing an independent Advisory Board on Quantum Computing and Blockchain, featuring experts from academia and industry like affiliations with Stanford and UT Austin. The board will: Assess quantum risks to blockchain systems.

Publish position papers and security recommendations. Support real-time responses to quantum advances. The first position paper on quantum risk assessment and a resilience roadmap is expected early in 2026.

Broader elements of the roadmap include: Immediate product enhancements, such as updates to Bitcoin address handling to improve quantum resistance. Long-term cryptographic research, focusing on adopting post-quantum signature schemes e.g., lattice-based like ML-DSA.

Ongoing efforts to mitigate risks to assets like Bitcoin without hype-driven panic. This proactive stance addresses growing concerns in the crypto space about quantum threats, aiming to future-proof user funds and infrastructure.

Coinbase has also released related research insights on the quantum threat to Bitcoin and mitigation strategies. ML-DSA (Module-Lattice-Based Digital Signature Algorithm) is the standardized name for what was originally known as CRYSTALS-Dilithium.

It is a post-quantum digital signature scheme selected and finalized by NIST in FIPS 204. It provides strong security against both classical and quantum attacks, based on the hardness of lattice problems — specifically, the Module Learning With Errors (MLWE) problem and a variant called SelfTargetMSIS (a nonstandard Module Short Integer Solution problem).

ML-DSA operates over the polynomial ring Rq=Zq[X]/(X256+1)R_q = \mathbb{Z}_q[X] / (X^{256} + 1)R_q = \mathbb{Z}_q[X] / (X^{256} + 1), where q=8380417q = 8380417q = 8380417 (a prime), and uses the Number Theoretic Transform (NTT) for efficient polynomial multiplication.

All coefficients are integers modulo ( q ), and the scheme employs rejection sampling, hint-based compression, and pseudorandom expansion from seeds via SHAKE-256 XOF. Parameter SetsML-DSA defines three parameter sets, each targeting different NIST security strength categories roughly corresponding to classical security bits and quantum resistance.

These parameters balance security, key/signature sizes, and performance (higher parameters increase sizes but provide more security margin). Signatures are larger than classical schemes like ECDSA (64–72 bytes) or Ed25519 (64 bytes), but signing and verification are efficient (often comparable or faster in optimized implementations, especially with AVX2).

Signing (Sign); Uses Fiat-Shamir with aborts (rejection sampling) for zero-knowledge:Derive message hash ? = H(H(pk) || M). Derive per-signature randomness ?” from K, randomness, ?. Loop (rejection sampling): Sample masking y ? [-??+1, ??]^? from ?”. Compute w = A y ? decompose to high bits w?. Hash ? || Encode(w?) ? challenge polynomial c (sparse, exactly ? ±1 coeffs via SampleInBall). Compute response z = y + c s?. Check bounds: ?z?_? < ?? – ?, low bits of w – c s? within bounds, hint h = MakeHint(…) has ? ? 1’s. If any fail ? retry with new ?. Signature ? = Encode(Encode(c) || z mod ±q || h).

Provable security in the quantum random oracle model (EUF-CMA / SUF-CMA). Hedged signing using fresh randomness is recommended to resist side-channels; deterministic mode exists but is riskier.

ML-DSA is designed as a direct drop-in replacement for ECDSA/EdDSA/RSA signatures in protocols needing quantum resistance, though larger sizes require protocol adjustments (e.g., in TLS, certificates). For the full formal spec, algorithms, and proofs, refer to NIST FIPS 204.

EU–India Seal ‘Mother of All Deals’ as Landmark Trade Pact Cuts Tariffs on Over 90% of Goods

0

India and the European Union have concluded a sweeping free trade agreement that will remove or sharply reduce tariffs on more than 90% of goods traded between the two economies, creating what European Commission President Ursula von der Leyen described as a free trade zone of nearly two billion people.

The deal, branded “historic” by both sides, comes at a moment of acute global trade tension. New Delhi is under pressure from steep U.S. tariffs on key exports, while the EU is recalibrating its trade relationships amid growing uncertainty in its long-standing economic ties with Washington under President Donald Trump.

Under the agreement, India will lower tariffs on a wide range of European products, including automobiles, machinery, and agricultural goods, while the EU will open its market further to Indian exports such as textiles, apparel, leather goods, marine products, chemicals, plastics, and gems and jewelry. Many of these Indian sectors have been directly hit by recent U.S. tariff hikes of up to 50%, making preferential access to the European market particularly significant.

“We have created a free trade zone of 2 billion people, with both sides set to gain economically,” von der Leyen said, adding that the agreement sends “a signal to the world that rules-based cooperation still delivers great outcomes.”

India’s Commerce and Industry Minister Piyush Goyal said the deal is expected to come into force in 2026, following ratification processes on both sides.

While India is only the EU’s ninth-largest trading partner—accounting for 2.4% of the bloc’s total goods trade in 2024—the EU is one of India’s most important commercial partners, alongside the U.S. and China. In financial year 2025, bilateral trade in goods between India and the EU reached 11.5 trillion rupees ($136.54 billion), with Indian exports at $75.85 billion and imports at $60.68 billion, according to India’s commerce ministry.

At the heart of the agreement are deep tariff concessions. The European Commission estimates that India will cut tariffs on European goods by around €4 billion ($4.7 billion) annually. More than 90% of EU exports to India—covering automobiles, machinery, chemicals, aircraft, and agri-food products—will face lower duties. Brussels said India has granted the EU tariff reductions that exceed those offered to any of its other trading partners.

One of the most striking elements of the deal is India’s willingness to ease protection in politically sensitive sectors. Tariffs on European cars will be reduced gradually from as high as 110% to 10%, while duties on car parts will be abolished over a period of five to ten years. European automakers with a presence in India include Renault, Volkswagen, BMW, and Mercedes-Benz.

India has also moved to nearly eliminate tariffs of up to 44% on machinery, 22% on chemicals, and 11% on pharmaceuticals. On agriculture, high duties on European exports such as wine, olive oil, spirits, and confectionery will be reduced or removed, giving EU producers preferential access to India’s fast-growing consumer market. At the same time, sensitive European agricultural sectors—beef, chicken meat, rice, and sugar—will remain protected from Indian imports.

Christophe Hansen, the EU’s commissioner for agriculture and food, said European wines, spirits, beers, and olive oil would enjoy preferential access to India under the agreement, calling it a major opportunity for European farmers and food producers.

Markets in India reacted nervously. Shares of major automakers fell on concerns about increased competition from European brands. Maruti Suzuki ended the day 1.5% lower, Hyundai Motor India closed down 3.6%, while Tata Motors and Mahindra & Mahindra fell 1.3% and 4.2%, respectively. Stocks of Indian alcoholic beverage companies also dropped, with Sula Vineyards sliding 4.1% and shares of United Breweries and United Spirits falling by more than 2%.

The Indian government sought to reassure investors, saying consumers would benefit from access to high-tech vehicles and greater competition, while Indian-made automobiles could also gain improved access to the EU market under reciprocal provisions.

But the gains could be substantial for India’s export sectors. Once the agreement takes effect, textiles, apparel, marine products, leather, footwear, chemicals, plastics, sports goods, toys, and gems and jewelry will face zero duties in the EU. These labor-intensive sectors account for about $33 billion in exports and were previously subject to EU tariffs ranging from 4% to 26%.

“This should boost India’s export competitiveness in these sectors, which are currently under strain due to higher U.S. tariffs,” said Sonal Varma, chief economist for India and Asia ex-Japan at Nomura.

The deal also carries major employment implications. Goyal said the agreement could generate six to seven million jobs in India’s textile sector alone, which is the country’s second-largest employer after agriculture. Beyond goods, the pact includes provisions allowing temporary entry and stay for professionals such as business visitors, intra-corporate transferees, contractual service suppliers, and independent professionals.

Analysts say India’s IT services, professional services, and education sectors are particularly well-positioned to benefit from these mobility clauses.

Geopolitically, the agreement is being closely watched in Washington. It is widely seen as a strategic hedge by both New Delhi and Brussels against increasingly unpredictable U.S. trade policy. Treasury Secretary Scott Bessent has already criticized the EU for pushing ahead with the deal, pointing out that Washington imposed 25% tariffs on India over its purchases of Russian oil, only for Europe to deepen trade ties with New Delhi.

President Trump has yet to comment publicly on the EU–India agreement, but the White House is unlikely to welcome a pact that reduces U.S. leverage over two major economic partners. India’s Petroleum and Natural Gas Minister Hardeep Singh Puri, however, struck a conciliatory tone, saying he expects U.S.–India relations to remain strong and expressing confidence that a bilateral trade deal with Washington would eventually be completed.

Indian Prime Minister Narendra Modi has praised the “landmark” agreement, echoing von der Leyen’s description of it as the “mother of all deals.” Both leaders are expected to highlight the pact at an EU–India summit, presenting it as a statement of commitment to open markets and multilateral trade at a time when global commerce is being reshaped by tariffs, geopolitics, and strategic rivalry.

With the ink barely dry, attention is now shifting from celebration to implementation—and to how the United States responds to a deal that signals India and Europe’s determination to diversify trade ties in an increasingly fragmented global economy.