Space Exploration Technologies, also known as SpaceX, has seen its shares slip below the initial public offering (IPO) price for the first time since its debut.
The stock finished Thursday’s session at $130.67, slipping under the $135 IPO price amid ongoing volatility that has erased much of the post-listing gains.
Shares of the Elon Musk-led company have declined in four consecutive trading sessions, plunging to a level 40% below a peak attained in the frenzied aftermath of an initial public offering (IPO) last month.
The decline underscores growing investor concerns over valuation, broader market pressures, and uncertainty surrounding the company’s near-term growth prospects.
Some analysts attribute the dropoff to sputtering demand as investors move past the company’s splashy public listing and take a closer look at its bottom line. Volatility often follows an IPO, they acknowledged, while differing in their assessments of the firm.
The retreat in the company’s stock prices came before the firm’s 13th Starship test flight, scheduled for Thursday, but ultimately scrubbed due to engine issues.
During the countdown, several of the Super Heavy booster’s 33 Raptor engines failed to ignite as expected, prompting the rocket’s onboard safety system to halt the launch sequence before the vehicle left the pad.
The mission was expected to be a major milestone for the Starship program, marking the first time the rocket would deploy 20 next-generation Starlink V3 satellites into space while also testing an in-space engine relight and other key flight objectives.
Following the scrub, SpaceX CEO Elon Musk said two engines would be replaced before the next launch attempt, which he expects could take place early next week.
While SpaceX remains a leader in satellite launches and space exploration, the move below its IPO price highlights the challenges even high-profile technology firms face in maintaining investor confidence amid shifting market conditions.
How SpaceX’s Historic IPO Sparked a Buying Frenzy
SpaceX’s stock market debut was one of the most anticipated public offerings in financial history, attracting overwhelming demand from institutional and retail investors eager to own a stake in Elon Musk’s space and satellite empire.
The company priced its initial public offering (IPO) at $135 per share, raising $75 billion in what became the largest IPO ever completed in the United States.
The record-breaking listing valued the company at more than $2 trillion, reflecting investor confidence in the long-term potential of its space launch business, Starlink satellite internet network, and artificial intelligence ambitions.
Investor enthusiasm was immediate. When trading began on the Nasdaq on June 12, SpaceX shares opened at $150, roughly 11% above the IPO price, before climbing as much as 31% intraday.
The stock eventually closed its first trading session at $160.95, representing a gain of about 19% from the offering price.
The strong debut was fueled by overwhelming demand, with reports indicating the IPO was oversubscribed several times, leaving many investors who failed to secure allocations scrambling to buy shares in the open market. The rally gathered further momentum in the days that followed as investors continued to pour money into the stock.
SpaceX shares surged to an all-time high of more than $225, driven by optimism surrounding the company’s dominance in commercial space launches, the rapid expansion of the Starlink satellite network, and expectations that the company would become a leading force in both aerospace and artificial intelligence.
The limited number of shares available for public trading also intensified buying pressure, amplifying the stock’s early gains.
However, the initial excitement gradually gave way to caution. Concerns over the company’s lofty valuation, heavy investment spending, broader weakness in technology stocks, and the prospect of insider share sales after lock-up restrictions expire triggered a sharp reversal.
Within weeks of its blockbuster debut, SpaceX shares erased much of their post-IPO gains, eventually slipping below the $135 offering price for the first time.
The decline underscored the volatility that often follows high-profile IPOs, as early optimism gives way to closer scrutiny of fundamentals and future growth prospects.
This marks a notable shift for a company that generated significant attention as it transitioned from private to public markets after 24 years under Elon Musk’s leadership.
Analysts note that the rapid rise and fall reflect typical post-IPO behavior for highly anticipated tech listings, where initial hype often gives way to profit-taking and more realistic valuations.
Some market watchers view the current levels as potentially attractive for long-term investors, while others caution that upcoming share lockup expirations and execution risks could add further pressure in the months ahead.
SpaceX remains one of the most valuable publicly traded companies, but the recent decline of it shares, underscores how quickly sentiment can shift even for a business with groundbreaking achievements in reusable rockets and satellite internet.
Invent, innovate and drive organizational transformation, performance, and growth. Capture emerging opportunities in changing markets while optimizing innovation and profitability. Digitally evolve your business or functional area, turning digital disruption into a competitive capability and advantage. Master the concepts of building category-king companies, and thrive.
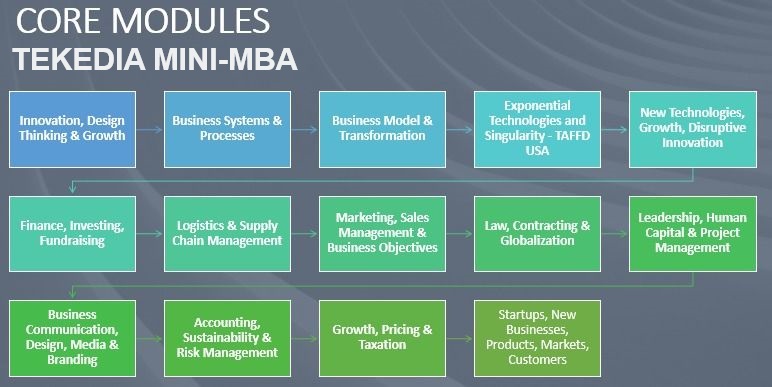
Registration for another edition of Tekedia Mini-MBA opens. Tekedia Mini-MBA, from Tekedia Institute, is an innovation management 12-week program, optimized for business execution and growth, with digital operational overlay. It runs 100% online. The theme is Innovation, Growth & Digital Execution – Techniques for Building Category-King Companies. All contents are self-paced, recorded and archived which means participants do not have to be at any scheduled time to consume contents. Our programs are designed for ALL sectors, from fintech to construction, healthcare to manufacturing, agriculture to real estate, etc.
More so, the sector- and firm-agnostic management program comprises videos, flash cases, challenge assignments, labs, written materials, webinars, etc and is delivered by a global faculty coordinated by Prof Ndubuisi Ekekwe. When we finish, we will issue a certificate from the Tekedia Institute, Boston USA.
Register and join us. You will emerge transformed with tools and capabilities that engineer confidence, performance and growth. Accelerate your leadership ascent with us! Here are our programs and costs.
Program Cost
Code
Description
Cost
MINI
Tekedia Mini-MBA. And WhatsApp School
US$170 or N120,000 naira
MINF
Annual Package: 3 consecutive MINI, and 2 optional capstones.
$340 or N180,000
MINR
(optional) Homework review; faculty will review your homework with feedback.
$30 or N10,000
CAPS
(optional) Tekedia capstone is a research paper, analogous to final college project.
Supply Chain Management, Global Partnership & Contracting – Adebayo Adeleke, ex-Chief of Contracting and Deputy Chief, Business Operations Division, US Army
Intellectual Property: Strategy, Management & Commercialization – Ifeanyi Okonkwo, University of Cape Town & Jackson, Etti & Edu
Business Relationship Management & Negotiation Skills - Charles Okeibunor, CEO IRMP
Due Diligence and Business Intelligence – Chike Obimma, Partner at NICCOM LLP (Commercial Law Firm)
Week 10: Leadership, Human Capital & Project Management
Leadership, Knowledge Management – Prof. Ayodeji Oyebola, Saint Mary’s University of Minnesota
Human Resources Management - Adora Ikwuemesi, Director Kendor Consulting
Leading and Managing Teams, Stakeholder Management with NICER Model – Dr. Chisom Ezeocha, Project Delivery Manager, Shell
Career Planning – Precious Ajoonu, Manager, Jobberman
Tax Treaties and Their Benefits - Emmanuel Eze, Manager, Federal Inland Revenue Service (FIRS)
Regional Case: Tax Law and Compliance in Lagos State - Abimbola Abdur-Rahman Lekki, Lagos Internal Revenue Service
Effective Product & Service Pricing, Accelerated Revenue, Profit Maximization - Saima Khan, Partner, Strategic Pricing Management Group, Toronto, Canada
Establishing Business Consulting & Advisory Services - Mustafa Yusuf-Adebola, Founder, Provisio Professional
Driving Profitable Growth, Marginal Cost, Scaling – Prof. Ndubuisi Ekekwe
Stimulating New Markets Through Innovation and Perception Demand – Prof Ndubuisi Ekekwe
Week 14: Startups, New Businesses, Products, Markets, Customers
The Mechanics of Minimum Viable Product and Product Development - Prof Ndubuisi Ekekwe
The NEP Framework – Discovering and Listening to Customers - - Prof Ndubuisi Ekekwe
Customer Validation and Building for What Customers Really Want. - - Prof Ndubuisi Ekekwe
Knowing and Defining Your Market - Prof Ndubuisi Ekekwe
Navigating Business Growth Phases - Prof Ndubuisi Ekekwe
ChatGPT, DALL-E 2 and Emerging AI Innovations: Business Opportunities in Africa - Zion Pibowei, Head of Data Science, Periculum Canada
How to Scale a Business/Startup - Jane Egerton-Idehen, Head of Sales Middle East & Africa at Meta (Facebook parent company)
Final Week: Execution and Closure
The Call to Business Execution, Closure – Prof Ndubuisi Ekekwe
Graduation Day – Prof Ndubuisi Ekekwe
Tekedia Live: Optional Zoom session which holds thrice per week (Tue, Thur, Sat at 7pm WAT). It is archived for those unable to make the session live. Our faculty members and invited guests rotate to anchor the sessions. Live provides a platform for members to ask questions and get live responses.
Welcome! Unleash your leadership potential, master business excellence, and embrace transformation with Tekedia Mini-MBA. Join us and experience a cutting-edge business management & leadership program: online, self-paced, and world-class. At Tekedia Institute, we co-learn with thousands of professionals and students, from many countries, on the mechanics of business, connecting innovation, growth and operational execution, across market territories and industrial sectors.
Our faculty members come from Microsoft, Google, Shell, Flutterwave, Nigerian Breweries, NNPC, Jobberman, Coca Cola, PwC, BUA Cement, and other great organizations. Besides pre-recorded courseware, thrice weekly, we hold live Zoom sessions (Tue, Thur and Sat at 7pm WAT) – Prof Ndubuisi Ekekwe, Tekedia Institute Lead Faculty.
Access to any Facyber Certificate program for free. Facyber offers online cybersecurity programs on policy, technology, management, and forensics.
Capstone Program
Here are the 12 tracks:
CLSM: Certificate in Logistics and Supply Chain Management
CBIS: Certificate in Business Innovation, Growth & Sustainability
CMAB: Certificate in Media, Advertising & Branding
CSBM: Certificate in Startup and Small Business Management
CIBA: Certificate in Business Administration
CPFM: Certificate in Personal Finance & Wealth Management
CMSM: Certificate in Marketing and Sales Management
CDBG: Certificate in Digital Business Growth
CIAM: Certificate in Agribusiness Management
CHRM: Certificate in Human Resources Management
CETS: Certificate in Exponential Technologies and Singularity
CBPM: Certificate in Business Transformation & Project Management
The program is completely capstone-based. Tekedia capstone is a research paper or a case study exploring a topic, market, sector or a company. It is the project component of Tekedia Min-MBA.
Theme: Innovation, Growth & Digital Execution – Techniques for Building Category-King Companies
Introduction
Over the last few decades, digital technology has emerged as a very critical element in organizational competitiveness. It has transformed industrial sectors and anchored new business architectures, redesigning markets and facilitating efficiency in the allocation and utilization of factors of production. The impacts have been consequential: continents like Africa are moving towards knowledge-based economic structures and information societies, comprising networks of individuals, firms and states that are linked electronically and in interdependent relationships. In this program, we will examine this redesign within the context of fixing market frictions and deploying growth business frameworks in a world of perception demand where meeting needs and expectations of customers are not enough.
Program Time: Sep 14 – Dec 5, 2026
Venue & Format: Online via videos, articles, webinars, and flash cases. Program is self-paced which means you consume the materials at your own time and pace. It is completely online. Where you live or your time zone would not be an issue as program is not live-delivered.
Cost: US$170 (N120,000 naira). We have a payment plan, i.e. installment payment plan (email us for details)
Target Audience: This program is designed for professionals and students across functional areas like sales, marketing, technology, administration, legal, strategy, finance, etc across all business sectors and domains. The program is designed for:
Ambitious mid-level managers seeking to advance their careers by acquiring essential business knowledge and skills.
Busy professionals who value continued education but require a flexible alternative to a traditional MBA program.
Experienced professionals aiming to broaden their business acumen, enhance leadership capabilities, and explore new career opportunities.
Professionals in transition, committed to staying informed about business trends and developing skills for continuous professional growth.
Mid-level managers and executives across industries, driven to accelerate career growth and take on increased responsibilities.
Technology and innovation-focused professionals looking to strengthen business acumen and strategic thinking.
Aspiring entrepreneurs seeking a solid foundation in business management and growth strategies.
Consultants and advisors aiming to expand their knowledge base and provide comprehensive solutions to clients.
Professionals transitioning into new roles or industries, recognizing the value of upskilling for success.
Students and recent graduates seeking a competitive edge in the job market by combining academic qualifications with practical business skills.
Tekedia Mini-MBA program offers a flexible and comprehensive learning experience tailored to the needs of ambitious professionals, providing the tools and knowledge necessary to thrive in today’s dynamic business landscape. Participants will have the opportunity to acquire knowledge that has value and can be used in everyday business activities.
Learning Objectives: To innovate is to set a new basis of competition in an economy, business sector or market. Sometimes, it results in disruption. This program is designed for private (large, SMEs, startups, sole businesses), public and government institutions, and individuals. Participants will:
Master the mechanics of growth – the reward of innovation – through frameworks, cases and evolving strategies.
Understand how to undergo transformation journey that is fully aligned with corporate objectives through measurable and realizable benchmarks.
Acquire business capability tools that do not just RUN their firms but can TRANSFORM them.
Design corporate growth experiments in Lab sessions based on One Oasis Strategy, Aggregation Construct, Double Play Strategy, Accumulation of Capability Construct, and more.
ETC
Why Tekedia Institute
Interactive Online Learning: Engage with industry experts and fellow professionals through our state-of-the-art online learning platform, where you can access course materials, participate in discussions, and collaborate on real-world case studies.
Comprehensive Curriculum: Gain a deep understanding of key functional areas such as strategy, marketing, finance, operations, and more, equipping you with the knowledge and skills to excel in any business environment.
Practical Case Studies: Apply your learning to real-world scenarios through hands-on case studies and projects, allowing you to develop critical thinking and problem-solving skills.
Flexibility and Convenience: Access the program online from anywhere at your own pace, fitting your studies into your busy schedule without compromising your professional and personal commitments.
Expert Faculty: Learn from renowned industry practitioners and thought leaders who bring their expertise and real-world insights to the program, ensuring you receive the most relevant and up-to-date knowledge.
Benefits of Tekedia Mini-MBA
Enhance Your Leadership Potential: Unlock your leadership capabilities and develop the skills to lead teams, drive innovation, and navigate complex business challenges with confidence.
Master Business Excellence: Gain a holistic understanding of business functions, strategies, and best practices, enabling you to make informed decisions and contribute to organizational success.
Embrace Digital Transformation: Stay ahead of the curve by embracing digital technologies and leveraging them to transform your business and stay competitive in the digital age.
Accelerate Your Career: With the Tekedia Mini-MBA on your CV, you’ll stand out to employers, demonstrating your commitment to continuous learning and your readiness to take on new responsibilities.
Network and Collaboration: Connect with a diverse community of professionals, expand your network, and foster collaboration opportunities that can lead to future partnerships and career advancements.
Cost-Effective Investment: Enjoy the benefits of a comprehensive business education at a fraction of the cost of traditional MBA programs, maximizing the return on your investment.
We run optional three Live Zoom sessions (two weekdays and one Saturday). This provides a way for our members to ask our Faculty and experts live questions and get feedback.
Tekedia Mini-MBA certificate sample
Tekedia Institute offers certificates at the end of all programs.
Our Contact Email: info@tekedia.com
Refund policy is full refund within 6 days from start of a program; after that, none, but we can defer as requested.
Lead Faculty of Tekedia Institute
Prof Ndubuisi Ekekwe is the Lead Faculty of Tekedia Institute
PhD, Electrical & Computer Engineering, Johns Hopkins University, USA
MBA, University of Calabar, Nigeria
BEng Electrical & Electronics Engineering ( Federal University of Technology, Owerri, Nigeria)
Prof Ndubuisi Ekekwe invented and patented a robotic system which the United States Government acquired assignee rights. Dr Ekekwe holds two doctoral and four master’s degrees including a PhD in engineering from the Johns Hopkins University, USA. He earned undergraduate degree from FUT Owerri where he graduated as his class best student. While in Analog Devices Corp, he co-designed an accelerometer for the iPhone. A recipient of IGI Global “Book of the Year” award, a TED Fellow, IBM Global Entrepreneur and World Economic Forum Young Global Leader, Prof. Ekekwe has held professorships in Carnegie Mellon University and Babcock University, and served in the United States National Science Foundation Committee.
The South African press called him “a doctor of innovation” for helping organizations on the mechanics of business innovation, strategy, and growth. Since 2009, the Chairman of Fasmicro Group which controls many startups and entities has been writing in the Harvard Business Review. He was recognized by The Guardian as one of 60 Nigerians Making “Nigerian Lives Matter” on Nigeria’s 60th Independence Day (Oct 1, 2020).
Trump Media & Technology Group on Thursday unveiled a premium data service that will provide paying customers with licensed, real-time access to content posted on Truth Social, a move aimed at Wall Street firms and other professional users seeking immediate access to market-moving information from the platform.
The new offering, delivered through an Application Programming Interface (API), will allow subscribers to receive real-time posts and historical data from selected Truth Social accounts. While the company did not specifically mention President Donald Trump’s account in its announcement, the service is widely expected to derive much of its value from the president’s frequent use of the platform for official statements on economic policy, tariffs, geopolitics and financial markets.
“Markets already move on Truth Social posts,” Trump Media interim Chief Executive Kevin McGurn said in announcing the service.
The launch represents Trump’s social media company’s latest effort to diversify beyond advertising and subscriptions by monetizing the unique influence of its platform, particularly as institutional investors, trading firms and news organizations increasingly monitor presidential communications for market-sensitive developments.
President Trump’s @realDonaldTrump account is the largest on Truth Social, with approximately 12.9 million followers as of Thursday, according to the company and third-party estimates. The president has routinely used the platform as his primary channel for announcing policy decisions, including tariffs, military actions, executive orders, and other government initiatives before they appear elsewhere.
That practice has effectively turned Truth Social into a critical source of information for financial markets, where investors increasingly rely on automated systems capable of reacting to headlines within milliseconds.
The new API is designed to serve precisely that audience.
Institutional investors, hedge funds, algorithmic traders, and financial data providers commonly purchase low-latency feeds from social media platforms to capture breaking information before it becomes widely disseminated. Such services are also used to build sentiment analysis models that scan posts for market signals and adjust trading strategies accordingly.
Unlike comparable products offered by other social media companies, however, Truth Social occupies a unique position because it hosts the primary communications channel of a sitting U.S. president.
That distinction has prompted renewed scrutiny from ethics experts, who believe the arrangement creates potential conflicts between public office and private financial interests.
Virginia Canter, an ethics attorney with Democracy Defenders Fund, said the arrangement raises significant concerns because President Trump continues to communicate official government decisions through a platform tied to his family’s financial interests.
“It’s a huge conflict of interest,” Canter said.
“He has an obligation to the American people to convey information to them publicly, and he’s now funneling it through a private channel in which he has a private interest as one of its largest shareholders.”
Canter added that Truth Social has effectively “become the de facto presidential press room.”
The White House referred questions to the Trump Organization, which declined to comment. Trump Media did not immediately respond to follow-up questions.
Although President Trump transferred his holdings in Trump Media to a revocable trust managed by his son, Donald Trump Jr., after returning to office, the Trump family remains the company’s largest shareholder.
According to Securities and Exchange Commission filings, approximately 114 million shares, representing about 42% of Trump Media, were transferred into the trust following Trump’s election victory.
The API launch also highlights how social media has become an important source of market-moving information. Financial firms have long subscribed to premium data products from platforms such as X and other networks to obtain faster access to breaking news and public sentiment.
Truth Social is now seeking to compete in that market by capitalizing on its role as the first destination for many presidential announcements.
The initiative could create a new recurring revenue stream for Trump Media at a time when the company continues to search for sustainable business growth. Since going public through a special purpose acquisition company merger in March 2024 under the ticker DJT, the company’s shares have fallen about 84%, according to FactSet data.
For investors, the premium data service underpins an effort to reposition Truth Social as more than a consumer social network by targeting institutional clients willing to pay for faster access to information capable of influencing financial markets.
However, analysts believe the service gaining broad adoption will likely depend on the extent to which Wall Street firms view Truth Social as indispensable for monitoring presidential communications, as well as whether ongoing ethical and political scrutiny affects institutional demand.
Binance founder Changpeng Zhao, widely known as CZ, recently drew a clear distinction between emerging technologies and sound money.
In a post on X, he stated, “AI is great, but it does not protect you against inflation. Bitcoin does.”
According to Zhao, Bitcoin offers protection against the erosion of purchasing power caused by inflation, reinforcing its appeal as a scarce digital asset amid ongoing global economic uncertainty.
His comment comes amid ongoing discussions about inflation’s impact on purchasing power and investor strategies in 2026. Many observers note that official consumer price inflation figures often understate the real erosion of money’s value through expansive monetary policies.
Bitcoin, with its hard-capped supply of 21 million coins, offers a decentralized alternative that cannot be inflated at will by governments or central banks.
CZ’s perspective aligns with the crypto asset foundational design as digital scarcity. Proponents view it as “digital gold,” capable of preserving wealth over time regardless of fiat currency debasement.
This thesis has gained traction during periods of monetary expansion, though Bitcoin’s price remains volatile in the short term.
However, the market has challenged the notion that Bitcoin always protects against inflation. During the global inflation surge of 2022, Bitcoin fell sharply alongside technology stocks despite inflation reaching multi-decade highs.
More recently, Bitcoin has often rallied following softer-than-expected U.S. inflation data because lower inflation increases expectations of interest-rate cuts, improving investor appetite for risk assets.
This suggests Bitcoin is currently influenced as much by monetary policy expectations and broader market sentiment as by inflation itself.
As of mid-2026, the asset has faced downward pressure amid broader market cycles, capital rotation into AI-related investments, and macroeconomic uncertainties.
On the other hand, Artificial intelligence while transformative for productivity and economic growth, does not function as a monetary asset. AI companies and tools can generate value and returns, but they do not serve as a hedge against currency dilution in the same way Bitcoin’s protocol does.
CZ’s remark separates the two: innovation drives progress, but sound money protects the fruits of that progress. The statement quickly circulated in crypto communities, echoing long-standing arguments from Bitcoin advocates.
Critics point to Bitcoin’s price swings as evidence against its reliability as an inflation shield in any given year. Supporters counter that true long-term protection comes from its immutable supply schedule and growing adoption as a global reserve asset, independent of any single government’s policies.
CZ, who stepped back from day-to-day Binance operations but remains influential in the space, has frequently shared views on market cycles and Bitcoin’s role.
His comments often move sentiment and highlight fundamental differences between technology sectors and monetary instruments.
As inflation concerns persist into 2026, CZ’s comparison underscores a key choice for investors: tools for growth versus assets designed to maintain purchasing power. Bitcoin continues to attract those seeking the latter in an era of unprecedented monetary experimentation.
Looking ahead, Bitcoin’s role as an inflation hedge is likely to remain a subject of debate.
As institutional participation continues to grow through exchange-traded funds (ETFs), corporate treasury adoption, and broader integration into the global financial system, Bitcoin may become less driven by its scarcity narrative alone and more influenced by macroeconomic factors such as interest rates, liquidity, and investor risk appetite.
Ultimately, Bitcoin’s outlook as an inflation hedge will depend on how it evolves within the global financial system.
HSBC has upgraded Indian equities to “Neutral” from “Underweight,” becoming the latest global investment bank to turn more constructive on the country’s stock market after easing oil prices reduced pressure on corporate earnings and government measures to stabilize the rupee helped bring foreign investors back.
The brokerage also raised its end-2026 target for the BSE Sensex to 84,000 from 80,500, implying an 8.6% upside from current levels. The move marks a reversal from HSBC’s bearish stance in April, when surging crude prices and geopolitical tensions prompted it to downgrade Indian equities in favor of North East Asian markets.
The upgrade indicates that India’s investment outlook has improved as one of the world’s largest oil importers. Lower energy prices are easing inflationary pressures, reducing input costs for businesses and improving macroeconomic stability after months of uncertainty triggered by the U.S.-Israel conflict with Iran.
“The oil shock has eased, taking some pressure off margins and lowering the risk of significant earnings downgrades,” HSBC said in a research note.
The bank’s more optimistic view follows a sharp retreat in global oil prices. Brent crude has fallen 33% from its April peak of $126.41 per barrel after the United States and Iran reached an interim agreement that eased fears of prolonged supply disruptions in the Middle East.
The decline brings good news for India because the country imports roughly 85% of its crude oil requirements, making energy prices one of the biggest determinants of inflation, corporate profitability, fiscal balances and the current account deficit.
Lower crude prices reduce transportation and manufacturing costs, ease pressure on consumer inflation, and lessen the government’s fuel subsidy burden. For listed companies, especially those in manufacturing, transportation, aviation, consumer goods, and chemicals, cheaper energy improves operating margins and lowers the likelihood of earnings downgrades.
The improved energy backdrop also gives the Reserve Bank of India greater flexibility on monetary policy while supporting domestic consumption.
Foreign Investors Begin Returning
Another factor behind HSBC’s upgrade is the return of overseas capital. Foreign portfolio investors have purchased approximately $1.6 billion worth of Indian equities so far in July, reversing four consecutive months of heavy selling.
The rebound is notable given the scale of capital that exited earlier this year. Foreign investors have withdrawn $27.7 billion from Indian stocks in 2026, already exceeding the previous annual record outflow of $18.9 billion recorded last year.
Much of that selling reflected a global rotation into technology and semiconductor stocks benefiting from the artificial intelligence boom. Investors shifted capital toward markets with greater exposure to AI leaders, including the United States, Taiwan and South Korea, while reducing positions in markets such as India that have relatively limited participation in the AI supply chain.
The stabilization of the rupee, helped by policy measures and improving external conditions, has also made Indian assets more attractive by reducing currency risk for overseas investors.
While HSBC’s outlook has improved, the bank cautioned that India’s recovery in foreign inflows may prove difficult to sustain as investors continue chasing opportunities tied to artificial intelligence.
The AI investment cycle has fundamentally altered global capital allocation.
Technology companies involved in advanced semiconductors, AI infrastructure, cloud computing and memory chips have attracted enormous investment as spending on AI accelerates worldwide. Markets with heavy exposure to companies such as Nvidia, TSMC, SK Hynix, Samsung Electronics and AI infrastructure suppliers have significantly outperformed broader emerging markets.
India has benefited from AI through software services and digital adoption but lacks a large domestic ecosystem of listed companies manufacturing advanced chips, AI hardware, or data center infrastructure. That structural difference has contributed to India’s relative underperformance this year.
HSBC noted that concerns remain over whether foreign investors will continue allocating funds to India once attention shifts back toward AI-related investment opportunities.
India Still Trails Regional Markets
Despite the recent improvement in sentiment, Indian equities remain behind their regional peers. The benchmark Sensex is down 7.7% so far this year, while the MSCI Asia-Pacific Index excluding Japan has gained 21%, driven largely by strong performances in technology-heavy markets.
HSBC continues to view South Korea as the strongest growth story in Asia, reflecting its central role in the AI semiconductor supply chain through companies such as SK Hynix and Samsung Electronics. However, the bank warned that concentrated investor positioning and leverage in Korean equities could continue generating elevated volatility.
Within India, HSBC favors sectors positioned to benefit from improving domestic economic conditions rather than export-driven technology industries.
The brokerage identified several preferred sectors:
Private sector banks are supported by healthy credit growth and improving asset quality.
Consumer discretionary companies that stand to benefit from easing inflation and stronger household spending.
Real estate developers, as lower financing costs and improving consumer confidence support housing demand.
Commodities companies, which could benefit from recovering industrial activity.
Select industrial firms positioned to capitalize on infrastructure investment and manufacturing expansion.
These sectors are viewed as the primary beneficiaries of lower energy costs and improved domestic demand.
HSBC’s upgrade follows a similar move by Goldman Sachs earlier this month, suggesting global investment banks are becoming more constructive on India after the sharp correction earlier this year.
However, the report also underscores that India’s recovery remains largely cyclical rather than structural. Lower oil prices have improved corporate earnings prospects and attracted foreign capital back into the market, but the country’s limited exposure to the global AI investment boom continues to constrain relative performance.