

Bitcoin’s recent attempt at recovery appears to be losing momentum as bearish pressure creeps back into the market.
After a brief period of optimism that saw prices stabilize trading above $72,000, the world’s largest cryptocurrency has resumed its downward trajectory, reflecting a sharp shift in investor sentiment.
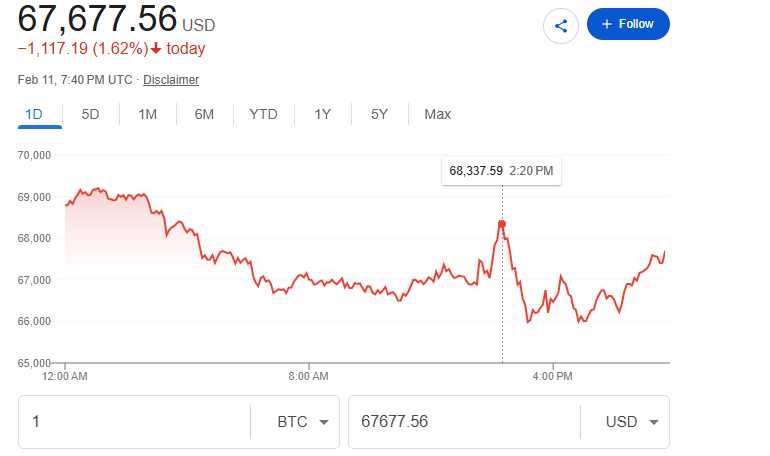
In the early hours on Wednesday, BTC traded below $67,000, as bearish concern intensifies. At the time of reporting the crypto asset was trading at $66,960. On a technical analysis the crypto asset looks poised to trade below the $60,000 zone.
Register for Tekedia Mini-MBA edition 20 (June 8 – Sept 5, 2026).
Register for Tekedia AI in Business Masterclass.
Join Tekedia Capital Syndicate and co-invest in great global startups.
Register for Tekedia AI Lab.
On the upside, reclaiming $70,000 and holding above $73,000 would signal renewed momentum and squeeze late sellers. Until then, rallies may be treated as selling opportunities.
Several analysts note that Bitcoin’s recent price structure reflects a market still dominated by distribution pressure rather than sustained demand recovery. After failing multiple times to consolidate above the $90K–$100K region, BTC entered a persistent downtrend characterized by lower highs and increasingly aggressive selloffs.
Reports reveal that many whales who entered the market near the $96,000 region are now sitting on significant unrealized losses following the subsequent price decline. After briefly testing those higher levels, Bitcoin reversed sharply, leaving late-cycle entrants exposed to downside pressure.

This dynamic suggests that some large investors may be reassessing risk, either reducing exposure or repositioning portfolios amid uncertain macro and crypto-specific conditions.
Recall that Bitcoin this year, traded as low as $59,878, as investor confidence faltered in the asset once hailed as “digital gold” and a unique store of value. Analysts mainly attributed the selloff to shifting expectations around U.S. macro policy.
Andri Fauzan Adziima, research lead at Bitrue, said the move lower followed a “hawkish shift in Fed expectations” after Kevin Warsh’s nomination as Federal Reserve chair, which signals “tighter liquidity and fewer rate cuts ahead.”

Recent market indicators now suggest that fear is once again dominating trader psychology, raising concerns about whether this pullback is a temporary correction or the start of a deeper slide. The Santiment chart shows that Bitcoin traders are still in strong fear mode, even after the price recovery. Market sentiment has not recovered at the same pace as the price.
Market sentiment indicators reinforce the cautious outlook. Data from Santiment shows that Bitcoin traders remain in a strong fear phase, even after the recent price stabilization. Social media discussions referencing terms such as “selling,” “lower,” and “bearish” continue to outpace optimistic phrases like “buy-the-dip” and “higher price.”
This divergence between price stabilization and lingering negative sentiment suggests that retail traders remain hesitant. Many appear to be waiting on the sidelines rather than aggressively accumulating at current levels.
Recent data shared by on-chain analyst Maartunn highlights a sharp wave of realized losses among large Bitcoin holders, pointing to an evolving market structure rather than a static downturn.
According to the figures, realized losses reached approximately $944 million on Feb. 3, $431 million on Feb. 4, $1.46 billion on Feb. 5, and $915 million on Feb. 6. These numbers reflect significant selling activity from investors who accumulated BTC near higher price levels and are now exiting positions under pressure.
With volatility intensifying and risk appetite thinning across global markets, analysts are closely watching key support levels that could determine Bitcoin’s next move. As sentiment turns cautious and capital rotates out of high-risk assets, the big question remains: is this just another routine dip, or could a more significant drop be on the horizon?
Outlook
Looking ahead, Bitcoin’s near-term trajectory will likely depend on whether the $60,000 support zone can hold. A decisive breakdown below this level could accelerate downside momentum, potentially triggering further liquidations and panic-driven selling.
Conversely, a sustained recovery above $70,000 particularly if accompanied by improving volume and sentiment could signal the beginning of a more stable consolidation phase. A break and hold above $73,000 would strengthen the bullish case and may encourage sidelined capital to re-enter the market.