DD
MM
YYYY

PAGES

DD
MM
YYYY

spot_img

PAGES

Home Blog Page 4145

Tradecurve to support it’s traders with Automated Trading (AI) feature rival Binance to launch NFT Loan Feature

0

Tradecurve is a hybrid exchange that features trading algorithms, ones that utilize artificial intelligence trading systems and have a proven track record, and can provide increased profitability for investors. The competing exchange Binance also announced that its NFT marketplace now features a new borrow feature for NFTs. We will analyze both of these projects to see which one can provide more value in the long term.

>>BUY TCRV TOKENS NOW<<

Binance and Its NFT Loan Feature

Binance, as an exchange, features a dedicated marketplace for non-fungible tokens (NFTs). This marketplace recently introduced a feature through which users have the ability to borrow cryptocurrencies by using their NFTs as collateral. At launch, the NFT marketplace supports only Ethereum borrowing against blue-chip NFTs, such as Ape Yacht Club (BAYC), Mutant Ape Yacht Club (MAYC), Azuki, and Doodles.

The interest rate on NFT loans is 7.91% p.a., and loan to value ratio can range between 40% to 60%, based on data gained from the official Binance NFT website. There are also no gas fees or Ethereum transaction fees that occur on each trade. As of May 26, 2023, BNB (BNB), the utility token of Binance, trades at $306.21. In the last 30 days, BNB saw a decrease in its value by 11.2%. In the last week alone, it’s down 1.2%. This new feature could bring the altcoin to new heights, but for the time being, it is still in the red zone.

>>BUY TCRV TOKENS NOW<<

Tradecurve and Automated Trading with AI

The Tradecurve exchange is at the forefront of technological advancements and enables algorithmic trading. Through this feature, each user can utilize an algorithm powered by artificial intelligence that will enhance and optimize the performance of their portfolio.

As centralized exchanges like Binance require users to complete a KYC procedure and have hefty fees associated with other trades that are a part of its offering. Moreover, it can be difficult to navigate through for newcomers.

>>BUY TCRV TOKENS NOW<<

Tradecurve is a new, innovative exchange that combines the best elements of DEXs and CEXs to provide a truly borderless and inclusive experience. Users are not required to complete the KYC procedure, and the exchange features the lowest fees in the industry.

In addition, Tradecurve is fully decentralized, which means that users control their own assets and can hold their own private keys. It also implements Proof of Reserves (PoR) to maintain transparency and features its own trading academy so that newbies can get familiar with using it.

During its Stage 2 presale, the TCRV utility token behind Tradecurve trades at $0.012. Analysts predict that its value can jump 50x during the presale and 100x at launch.

The team also plans on onboarding 100,000 new users during its first three months of operation, and the token will get listed on Tier-1 CEXs and on Uniswap.

For more information about TCRV presale tokens:

Website: https://tradecurve.io/

Buy presale: https://app.tradecurve.io/sign-up

Twitter: https://twitter.com/Tradecurveapp

Telegram: https://t.me/tradecurve_official

Kenyan President William Ruto Urges African Leaders to Embrace Pan-African Payments to Reduce Reliance on US Dollar

0

Kenyan President William Ruto has called on all African leaders to embrace pan-African payments to reduce reliance on the globally-bullish US dollar.

Speaking at a forum on the African Continental Free Trade Area (AfCFTA) on Monday, Ruto urged his peers in Africa to mobilize central and commercial banks to join Pan-African Payments and Settlement System (PAPSS) which was formed in January 2022.

He expressed concerns over the challenges faced by African countries and local banks, who often rely on correspondent banks in the US and Europe to complete payments between African currencies, resulting in delays and additional charges.

In his words,

“We are all’ struggling to make payments for goods and services from one country to another because of differences in currencies. And in the middle of all these, we are all subjected to a dollar environment. There has been a mechanism where all our traders can trade in the local currency and we leave it to the Afreximbank to settle all the payments. We do not have to look for dollars; our businessmen will concentrate on moving goods and services and leave the arduous task of currencies to Afreximbank.

“I suggest that we have a mechanism where we can settle all our payments whether between our countries or externally using our local currencies. And we have a mechanism like the one that has been put up by the Afreximbank so that we don’t have to be hostage to any one currency. Without a single payment platform, payment instructions from one African country to another typically pass through several intermediary financial institutions, leading to increased costs, complications, problems, and unnecessary currency fluctuations and it ends up being a whole ecosystem of confusion.”

A 2021 business day report revealed that African countries with 42 different currencies are losing $5 billion annually, which is why intra-African trade is constrained and the Small and Medium Enterprises (SMEs) are the most affected. The current reliance on US dollars has led to a mismatch between demand and supply, causing importers including oil marketers and manufacturers to face difficulties. The shortage of the dollar has also put pressure on the Kenyan shilling, which saw it depreciate by 12.1% since the beginning of the year.

This saw Ruto call for the adoption of PAPSS in the wake of challenges faced by Kenya, such as fuel shortages and economic problems attributed to a dollar shortage. Reports reveal that African traders and their local banks are using correspondent banks, usually in Europe to complete payments between two African currencies largely in dollars, and sometimes in euros. Payment usually takes up to three to five days to get to the recipient’s bank.

Importers such as oil marketers and manufacturers have since last year complained of a gaping mismatch in demand and supply of the US dollars, prompting them to buy it in batches and levels way above the official rate. The Kenya Association of Manufacturers, for example, last year said the dollar crunch strained relations with suppliers at a time competition for raw materials had intensified due to rising demand amid lingering supply chain constraints.

The unit has remained under sustained pressure from the US dollar due to higher demand than supply in a high-inflation environment that has seen investors shift their assets to a haven. Kenya suffered an acute shortage of fuel which the oil marketers largely linked to delays in releasing cash for fuel subsidies creating cash flow challenges, while the government accused the firms of hoarding the commodity.

As part of efforts towards addressing this challenge, AfCFTA is reportedly working with Afreximbank to establish a Pan-African Payment and Settlement System (PAPSS), which will enable Africans to transact in real-time on a digital platform with some entity in other parts of the continent using their local currency, so they will not have to worry about converting to a dollar, Euro, or any currency.

As more countries move away from the US dollar, there is a growing shift in the focus on international trade. Countries are increasingly looking to trade with each other using their currencies, rather than using the dollar as a medium of exchange. This shift has the potential to reshape the global economy, as it could reduce the dominance of the US and increase the influence of other countries.

One of the main benefits of using alternative currencies in international trade is that it can reduce the risks associated with exchange rate fluctuations. When countries trade using the dollar, they are exposed to the risk of fluctuations in the value of the dollar, which can impact the profitability of their trade. By using their currencies, countries can reduce this risk and ensure that they are not impacted by external factors beyond their control.

China’s UnionPay Takes The Crown On Debit Cards

0

UnionPay, the gigantic Chinese payment company, has overtaken Visa on the global debit card market, commanding 40.03% in 2022, with Visa 38.8%, on settlement volume of $16.227 trillion and $14.109 trillion respectively. A decade ago, Visa held 80% of the market while UnionPay was just around 1-2%. The country called China has bulldozed itself into the center of the world economy in many domains.

The Report

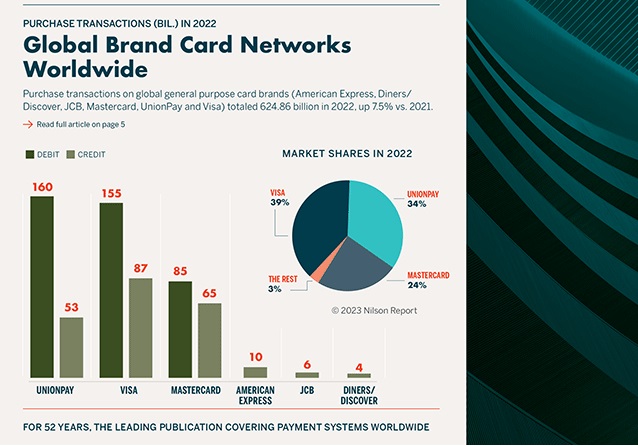
Credit, debit and prepaid cards carrying the brands of Visa, UnionPay, Mastercard, American Express, JCB and Diners Club/Discover—the global card networks—generated a combined 624.86 billion purchase transactions worldwide for goods and services in 2022, up 7.5% over 2021. Consumer, small business and commercial card products are included in those purchase transactions. All debit card figures mentioned in the text and used in the charts and tables on this page and pages 6, 7 and 8 include prepaid cards.

Of all global network purchase transactions worldwide in 2022, Visa brand credit and debit cards generated a 38.76% market share. This was a decline of 10 basis points (bps) from 38.86% in 2021. Visa credit cards generated 38.73% of credit card purchase transactions, an increase of 121 bps. Visa’s share of debit card transactions was 38.78%, down 82 bps.

UnionPay credit and debit cards accounted for a 34.04% share of global network purchase transactions, a slip of 4 bps from 2021. Debit cards with the UnionPay brand held a market share of 40.03% of all debit card purchase transactions, an increase of 139 bps. The market share for UnionPay credit cards among all credit card purchase transactions was 23.45%, a decrease of 230 bps.

Credit and debit cards with the Mastercard brand held a 24.00% market share of all global network purchase transactions worldwide, down 11 bps from 2021. Debit cards with the Mastercard brand held a 21.19% share of all debit card purchase transactions, a decline of 57 bps. Mastercard brand credit cards had a 28.97% share of all credit card purchase transactions, up 56 bps.

American Express credit card purchase transactions had a 4.61% market share of all global network credit products in 2022, up 37 bps from 2021. JCB cards had a 2.53% share, up 12 bps. Diners Club/Discover cards had a 1.72% share, up 4 bps.

Debit cards accounted for 63.88% of total purchase transactions on the global networks in 2022. This was a decline of 78 bps from 2021. For Visa, debit card purchase transactions were 63.91% of the network’s worldwide total, down 198 bps. UnionPay purchase transactions were 75.12% debit, an increase of 182 bps. Mastercard purchase transactions were 56.40% debit, a drop of 196 bps.

Total volume—purchases of goods and services combined with cash advances and withdrawals—was $40.645 trillion in 2022, a local percentage increase of 4.4% over 2021. Visa and Mastercard cards combined accounted for 54.83% of total volume, an increase of 283 bps. UnionPay cards generated 39.93%, a decline of 357 bps. American Express, JCB and Diners/Discover accounted for 5.24%, up 75 bps.

Debit card purchase volume, which excludes debit card cash withdrawals, tied to UnionPay, Visa and Mastercard cards reached $16.711 trillion in 2022. This was up 1.2% from 2021. Credit card purchase volume for all network brands, which excludes credit card cash advances, reached $19.462 trillion, up 8.7% from 2021.

When comparing worldwide purchase volume—spending for goods and services—by product type, UnionPay debit cards had the largest market share for the 10th consecutive year. The second-largest product based on 2022 purchase volume was UnionPay credit cards, followed by Visa credit cards (which overtook Visa debit cards), Mastercard credit cards, Mastercard debit cards, American Express credit cards, JCB credit cards and Diners Club/Discover credit cards.

UnionPay cards accounted for $44 of every $100 in purchase volume handled by the global networks. This was down from $48 in 2021. Mastercard and Visa combined accounted for $50 of every $100, up from $47 in 2021. Visa cards accounted for $32 of every $100. Mastercard cards accounted for $18 of every $100.

On the Visa global network, credit cards accounted for 50.40% of its credit and debit card purchase volume, an increase of 248 bps from 2021. Credit cards accounted for 56.63% of Mastercard’s global purchase volume for all products, an increase of 104 bps. On the UnionPay global network, credit cards accounted for 49.02% of its credit and debit purchase volume, an increase of 61 bps.

When measuring only credit card purchase volume for all global networks, UnionPay held a 39.91% market share, a drop of 487 bps versus 2021. Visa credit cards held a 30.22% share, an increase of 218 bps. Mastercard’s credit card share grew 154 bps to 19.11%. American Express’s share grew 98 bps to 7.92%. JCB’s share was up 7 bps to 1.60% and Diners Club/Discover’s share was up 9 bps to 1.25%.

When measuring only debit card purchase volume, UnionPay’s market share fell 342 bps to 48.33%. Visa’s share increased 160 bps to 34.63% and Mastercard’s share grew 182 bps to 17.04%.

Cash withdrawals using debit cards plus cash advances using credit cards reached $4.471 trillion in 2022. This was 11.00% of total global network volume. In 2021, that figure was 11.64%.

Global network brand credit, debit and prepaid cards in circulation reached 16.72 billion at the end of 2022, up 4.2% from 2021. Of the global total, UnionPay cards accounted for 56.49%, down 101 bps from 2021. Visa cards held a 25.09% share, up 76 bps. Mastercard cards held a 16.23% share, up 12 bps. JCB’s share was 0.91%, up 2 bps. American Express’s share was 0.80%, up 4 bps, and Diners Club/Discover’s share was 0.48%, up 6 bps.

Visa, Mastercard, American Express and Discover credit cards issued in the US generated $5.451 trillion in purchase volume in 2022, an increase of 19.5%. US credit cards accounted for 28.01% of all global network credit card purchase volume.

Their market share grew 252 bps over 2021. Purchase volume tied to credit cards issued outside the US increased 5.1% to $14.012 trillion.

Mastercard credit card purchase volume generated by cards issued in the US grew 21.8% to $1.320 trillion. Outside the US, purchase volume on Mastercard credit cards increased 16.4% to $2.399 trillion. Visa purchase volume from credit cards issued in the US reached $2.840 trillion, an increase of 18.2%. Outside the US, credit card purchase volume tied to Visa cards grew to $3.041 trillion, an increase of 16.3%. American Express purchase volume generated by US credit cards reached $1.080 trillion, an increase of 20.9%. Amex credit cards issued outside the US increased 32.6% to $460.39 billion.

Purchase volume on Visa and Mastercard debit cards issued outside the US was $4.526 trillion, an increase of 11.3% over 2021. Purchase volume on debit cards issued in the US reached $4.109 trillion, up 5.4%.

Mastercard purchase volume tied to debit cards issued outside the US grew 21.6% to $1.728 trillion. Purchase volume on Mastercard debit cards issued in the US increased 2.6% to $1.120 trillion. Visa purchase volume tied to debit cards issued in the US grew 6.5% to $2.989 trillion. Outside the US, Visa debit card purchase volume grew 5.7% to $2.798 trillion.

Purchase transactions initiated by Visa credit cards issued in the US increased to 31.25 billion, up 14.1%. Outside the US, Visa credit card purchase transactions grew to 56.17 billion, up 13.0%. Debit card purchase transactions tied to Visa cards issued in the US were up 5.7% to 60.78 billion. Outside the US, Visa debit card purchase transactions reached 94.03 billion, up 2.9%.

Credit card purchase transactions tied to Mastercard cards issued in the US totaled 14.02 billion, an increase of 18.3%. Outside the US, Mastercard credit card purchase transactions grew to 51.37 billion, up 10.4%. Debit card purchase transactions initiated by Mastercard cards issued in the US were up 0.2% to 23.26 billion. Outside the US, Mastercard debit card purchase transactions reached 61.32 billion, up 4.7%.

Lemonade Finance Rebrands to ‘LemFi’ as Part of Its Expansion Plan

0

Fintech company Lemonade Finance has rebranded to LemFi, as part of its expansion plan to enter into new territories.

The company stated that it wanted a unique approach, so it decided to find a simple yet powerful way to set itself apart from the other players in the fintech space, which will enhance the brand’s identity. The recent branding also comes with a new typeface and a website.

Speaking on the rebranding, Lemonade Finance country manager Precious Ama Kwartemaa Oduro said,

“There are many players in our space, we needed something simple that will also help us stand out even as we look to do more. Now the business is going to provide International payments for everyone. Before, it was international payments for immigrants in the diaspora. Immigrants like our family and friends have gone to seek opportunities in the diaspora.

“I believe as a company, we have reached a point where we are trying to extend our operations beyond Africa. We are actually going global. So we felt it was right to rebrand and that’s a fresh start.”

Kwartemaa further stressed that the rebranding will help reposition the business as the preferred choice for all consumers, adding that it will differentiate the brand from others and also simplify the brand’s identity.

Speaking on the new name, she said it will bring on board new products as well as maintain the fintech’s core service of providing the best remittance solutions.

In her words, “We are going to maintain whatever we’re doing and include a few additions. Our services remain the same. Because remittance is our call service for now; we are still going to stick to providing the best remittance solutions to Ghanaians. But the only difference will be a change in our name and brand identity.”

Apart from expanding its payment services to other countries, LemFi will be launching additional products and services to make cross-border transfers convenient for all.

Founded in 2020 by Ridwan Olalere, Lemonade Finance was built to be a borderless money app for Africans. To allow Africans to use their money seamlessly, Lemonade Finance has provided them with access to currencies that matter to them, notably the currency of the country they are in and that of their home country. This is a big deal for Africans in the diaspora who have businesses in Africa but want to move their money to foreign currencies.

The company offers local and international transfers to Ghana, Kenya, Nigeria, Canada, and the United Kingdom (UK) instantly without hidden fees, and makes international transfers at the real market exchange rate.

In 2022, it expanded to 7 new markets Senegal, Ivory Coast, Benin Republic, Cameroon, Tanzania, Rwanda, and Uganda. The new expansion opened it to a larger share of the African market, keeping its promise to build the biggest neobank for African immigrants.

Tesla Model Y Leads The Market And Lessons on Category-King Products

1

It is a new age and a new king is here: Tesla  is leading the future. Yes, “For the first time ever, an all-electric vehicle — specifically the Tesla Model Y — is now the world’s bestselling car. According to analyst data from Jato Dynamics, the Tesla Model Y has surpassed Toyota’s RAV4 and Corolla models to top global sales rankings in the first quarter of 2023. That’s especially impressive given pricing for the 2023 Model Y starts at $47,490, considerably more than the 2023 Corolla ($21,550) and RAV4 ($27,575).”

This is a validation that innovation must not necessarily result in cheaper or lower cost within a product category. In other words, we are wrong when we posit that in a consumer business, that innovation must lead to a reduction in price.

The overriding theme is that disruptive innovation must come with a better price model even at a superior product performance. What Tesla has done here is clear: pricing, while important, is not the only factor to win a market. Tesla Model Y is outselling old products even though it is about twice their prices.

Rethink your #strategy and deliver products beyond Needs, Expectations, and aim at Perceptions of customers. At perceptions of customers, you create fandom, turning customers into fans. And that means, you have set a new basis of competition, totally orthogonal to what your competitors do. Being cheap cannot guarantee a market share; you must move beyond Needs to at least meet the Expectations of your customers.

The interesting thing is that all products that succeed at the level of perception are usually disruptive in their sector or industry. Google search cannot be considered to fall in the category of perception because many people already craved for better search because neither Microsoft nor Yahoo was offering a good one. So a product could be disruptive and yet not a percepting product. However, all percepting products are disruptive.


Comment on Feed

My Response: Absolutely, products vary. Yes,  if Elon Musk had submitted his pricing model for winning a market share, for an MBA thesis, he possibly might have received a D. It is not common to be 2X mean cost and still win market share in a consumer business where many things are against you. The non-EVs have the whole world but EVs are just a few markets with electricity. Yet, in those small markets, Tesla outsold all.