It is not a surprise to people who have been following strategic moves of emerging businesses in various sectors in the last 5 years that Ibadan eventually made it to the global startup ecosystem map in 2021. However, it is a surprise to many that the founders and employees of the businesses helped the city attain the status despite numerous challenges. These challenges, according to our checks and business development experts who spoke with our analysts, include lack of an effective transportation system, modern facilities for business operation and security issue.
The report of StartupBlink indicates that the city saw a massive increase in ranking, jumping 601 spots to 353rd globally and 2nd in Nigeria, surpassing Abuja. “Ibadan is an ideal place to locate for Social & Leisure, Software and Data and Health startups. As the most popular industries in Ibadan, there is a sample of 2 Social & Leisure startups in Ibadan, 1 Software and Data startups in Ibadan, and 1 Health startups in Ibadan, on the StartupBlink Map. On the StartupBlink Global Startup Ecosystem Map there is also a sample of 6 startups in Ibadan, 1 accelerator in Ibadan, 1 coworking spaces in Ibadan, 1 organization in Ibadan and no leaders in Ibadan.”
Snap, Reality, Crop2Cash, Alerzo, CuraNetwork and Knitle were mentioned are startups placing the city on the global map. Having these startups is equally not a surprise because our checks indicate that tech hubs and co-working spaces which were established between 2017 and 2019 aided their recent performance and growth. For instance, Wennovation Hub, LPI Innovation Hub, iBridge Hub, Ecco Hub, Primacy edge Hub and SteinServe Hub which are located in strategic areas in the city have what it takes to enable effective operation of some of the startups.
The placement of the city on the map has further reinforced this submission. Therefore, tech hubs and co-working spaces should not only be situated in Bodija, Challenge, Ring Road, Dugbe and other highbrow areas. More office buildings are needed in emerging areas such as Mokola, Okebola, Moniya, Olodo, Ife-Ibadan Expressway, Agodi-Gate and others.
For the developers that build for investors, it is high time that the investors are advised to consider construction of co-working spaces instead of massive interest they have been having in shopping complexes and shop-houses in the last few years. No doubt, the shop property type outperforming the office property type in the city. The current status of the city within the global startup ecosystem should be a key element for investment-interest shift.
Additional reports by Mubaarak Abdulhameed [a Builder and Quality Engineer] and Mariam Akanni [a Real Estate Marketer]
Nigeria created jobs this week when water found its way into the well-renovated and refurbished National Assembly complex in Abuja; please do not blame the rainfall! If we have 36 of these episodes, we will create temporary jobs for 3,600 people! You see why things are not working: if the high priests can be lost this way, the signals from the antenna of Nigeria’s future are certainly gone.
Yes, if the parliamentarians cannot supervise the quality of work in their offices, how do you expect them to supervise or organize Nigeria? Sure – it is rainfall and bad things happen, even though I will not naturally expect rain to follow the spider into the palace! Do not get me back to the village where proverbs are like the kolanuts upon which words of wisdom are eaten.
Okenye adigh? an? n’?l? nne ewu am?? n’ogb?r? [An elder does not sit at home and watch the she-goat suffer the pain of childbirth tied to a post], says an African proverb. Today, both the elder, goat, rope and post are all tethered. Tufiakwa.
The financial markets constitute a socioeconomic ecosystem where individuals, organizations and institutions can trade various financial instruments (metals, currencies, stocks, securities, indices, oil, and now cryptocurrencies, etc.). Here these instruments are traded at a fair cost and on the basis of demand and supply. Trading the financial markets carries a substantial amount of risk and the need to make adequately informed decisions (while trading) cannot be overemphasized. While concepts like Technical analysis (via price action) and fundamental analysis are reasonably effective, it is imperative to have a solid trading plan and strategy that is robust and sustainable.
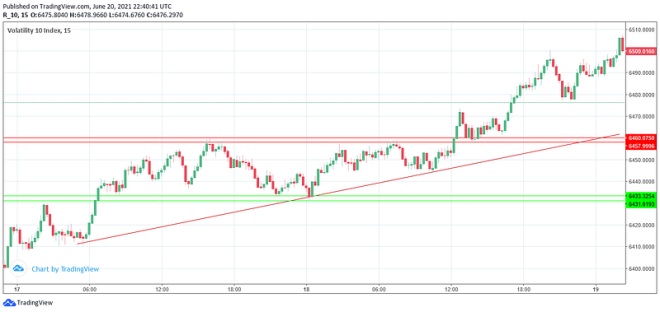
Personally, I do not believe that any financial instrument completely exhibits Brownian behavior. This is because prices will usually respect key historical zones (supply and demand zones) as well as market channels. A good example can be seen in the volatility 10 index chart below (the demand zone is marked with green lines and the supply zone is marked with red lines, the market channel was is also marked with a red diagonal trend line).
Volatility 10 index price chart
From the chart we can see that the price occasionally bounced-off the marked zones and this forms the basis for price-action trading.
Some statistical tests can be carried out on the close price of financial instruments (to ascertain key metrics which can further be used to better understand market behavior); one of which is the Augmented Dickey-Fuller test. This test is used to check if a particular asset or instrument will revert to its rolling mean after a market swing (in upwards or downwards direction).
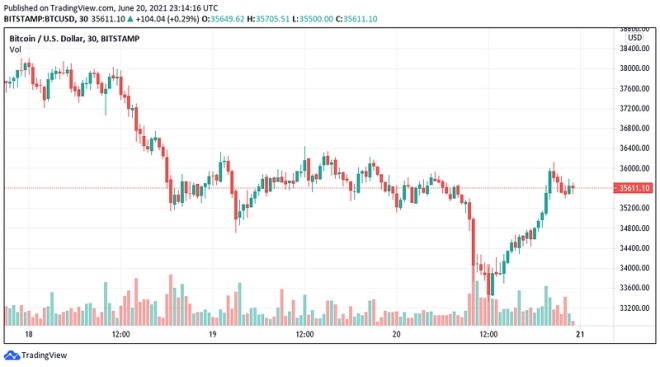
The Bitcoin stock-to-flow model makes it possible to trade it against a base currency on the foreign exchange market. This means that as with the Volatility 10 index above, bitcoin can be represented (on the charts) by its open, high, low and close prices and consequently traded with leverage at varying trade volumes. The bitcoin chart can be seen below.
The bitcoin against US dollar price chart
Seeing that there exists a degree of repetitive behavior of in price movement, can this behavioral pattern be recognized by a machine learning model?, if yes what model could be ideal?
Well, I hope that this article guides your discretion in answering these questions. For demonstration I have used the bitcoin price data (from April 2013 to February 2021) as obtained from kaggle.
WHY LSTM?
LSTM (Long Short-Term Memory) is a deep learning model that helps with prediction of sequential data. LSTM models prevail significantly where there is a need to make predictions on a sequence of data. The daily OHLC (Open, High, Low and Close) price of any financial asset constitutes a good example of a sequential data.
IMPLEMENTATION
As proof-of-concept, I have implemented an LSTM model for predicting Bitcoin’s price using python. I have outlined my step-by-step procedure as well as my thought process every step of the way. Without further ado, let’s go!
Firstly, we import the requisite python libraries
import numpy as np #Python library responsible for numerical operations
import pandas as pd # The pandas dataframe is a python data structure that helps construct rows and columns for data sets`
import matplotlib.pyplot as plt # This library is responsible for creating the necessary plots and graphs
import tensorflow # This is a python framework with which different models can be easily implemented
INGESTING THE DATA SET
data = pd.read_csv(‘coin_Bitcoin.csv’) # Here we are simply using pandas to import the csv file containing the BTC data
data.head() # Taking a quick look at the first 5 rows of the data
The first five rows of the bitcoin price data
We only require the Date, High, Low, Open and Close columns and so we drop every other column. Since it is a time-series data, it is best to set the date column as index. This way we can easily observe price behavior over time.
In a bid to ascertain more insights on price changes, we create a column that constitutes the daily Logarithmic returns. The reason we are interested in this metric is partly because stock returns are assumed to follow a log normal distribution and also because log returns is a more stationary property than the regular arithmetic returns.
Thus,
required_data[‘% Returns’] = required_data.Close.pct_change() # we find the percentage change using the pct_change() method
required_data[‘Log returns’] = np.log(1 + required_data[‘% Returns’]) # from the percentage returns we can easily compute log returns
required_data.dropna(inplace=True) # We drop all null/NaN values so that we do not get a value error
I have used the close price and log returns in training the model inputs because the close price is usually the most effective parameter for evaluating price changes, and the log returns offers stationarity to the model.
Let’s take a look at the close price curve:
Close price curve and also the log returns:The log returns curve
As seen in the Log returns curve, the values oscillate around the zero mean value, thus indicating stationarity.
x = required_data[[‘Close’,’Log returns’]].values #The requires data fields are the Close price and Log returns
Next stop, data normalization. Normalization helps to narrow values to a range 0?—?1 so as to annul the effect of data points constituting high standard deviation. This means that in a situation where later values are significantly higher than earlier values (as with Bitcoin), normalization will help to reduce the effect of higher values on the overall prediction.
We then import the relevant libraries:
from sklearn.preprocessing import MinMaxScaler
from sklearn.preprocessing import StandardScaler
scaler = MinMaxScaler(feature_range=(0,1)).fit(x) # we pass the relevant data to the MinMax scaler
x_scaled = scaler.transform(x)
For the training the model outputs, we specify only the closing price as that is what we want to predict in the end.
y = [x[0] for x in x_scaled] #Using the slice notation to select the Close price column
Now we want to allocate 80% of the data as training set and 20% as test set, an so we specify a split point
split_point = int(len(x_scaled)*0.8) # This amounts to 2288
Creating the training and testing sequence:
x_train = x_scaled[:split_point]
x_test = x_scaled[split_point:]
y_train = y[:split_point]
y_test = y[split_point:]
We then try to verify that the datasets have the right dimensions:
assert len(x_train) == len(y_train)
assert len(x_test) == len(y_test)
Now we label the model:
time_step = 3 # the time step for the LSTM model
xtrain = []
ytrain = []
xtest = []
ytest = []
for i in range(time_step,len(x_train)):
xtrain.append(x_train[i-time_step:i,:x_train.shape[1]]) # we want to use the last 3 days’ data to predict the next day
We can see that while the predicted values are not exactly the same as the original values, the model predicted the overall direction reasonably well. I believe that this model can be combined with other models (like the Autoregressive Integrated Moving Average model) to proffer better insights as to the overall market sentiments.
NB: This article does not constitute a financial advice as it is solely intended to demystify the financial markets (with Bitcoin as a case study), and show how machine learning can be leveraged-on to investigate different financial assets. Cheers!
A key shame as Nigeria fights insecurity is that despite spending billions of naira, the nation has been unable to develop an indigenous security industry in equipment design, development and manufacturing. While the ethical dilemma remains, the fact is this: if the parliament has inserted a simple clause like “10% of this money must be spent on locally sourced equipment”, we could be on the path of building indigenous capacity in defense.
Simply, from night vision goggles to drones to mapping systems, many defense startups would have mushroomed. Yes, if Defense HQs spent 10% of its budget on Nigerian defense startups, we would have added more than 1 million jobs since 2013!
But you know one thing? The latest request to borrow$6.18 billionshould only be approved by inserting this clause: 10% of this money must be spent on indigenous products and services in any portion earmarked for security. Also, the newly planned$1.76 borrowing for security should also require 10% to be spent on indigenous products and entities.
Nigeria plans to borrow 722.53 billion naira ($1.76 billion) from domestic capital markets for additional security spending, Finance Minister Zainab Ahmed said on Wednesday.
As part of Nigeria’s security spending, the World Bank also agreed to allow the government to restructure existing loans of 39.58 billion naira to supplement the funds, she told reporters after a cabinet meeting.
The cabinet also approved an allocation of 83.56 billion naira for the purchase and deployment of 30 million doses of the Johnson & Johnson COVID-19 vaccine
Do not tell me that we do not have these products and companies. I can tell you that if Nigeria opens this playbook, some of our citizens in US, Europe, etc will relocate to build companies with their home brethren to take advantage of these opportunities. Indeed, this is an opportunity to seed a new creative sector in the nation.
With many citizens becoming afraid to go to farms, I expect 2022 to be exceedingly challenging in Nigeria. No matter whatever they publish, I will struggle to believe any number that shows that agricultural productivity or output has gone up. So, if there is any time to plan for interventions, this moment calls for one. But instead of going for loans, state governments in Nigeria can design a playbook around their diasporas. Yes, find a framework to get those living in North America, Europe and beyond to support the state, via market systems which drive economic developments.
This is my recommendation for the states:
Build institutions and demonstrate probity and accountability in the state affairs.
Design and develop protocols to reach all Diasporas from the state. A dedicated ministry to track them from village to village, and open a roadmap to reconnect them to the state vision.
Open Sam Mbakwe’s Playbook: share with them where you are going, the resources you have, and what you need from them.
Provide massive incentives to shape how they allocate investment capital
When they commit by supporting your government through market systems, sustain the loop, and stay accountable.
The fact is this: Nigerian states are at inflection points and they need new playbooks to unlock new vistas of growth. Looking at the paralysis at the center, they need to work harder to tap into massive knowledge and economic wealth of their diasporas.
At no time in the history of this nation has its best export become agents to drive its future. State governments should work harder to create a multiplier effect, and get some of our well positioned citizens around the world to help drive developments.
It was a very common instruction from the headmaster: tell your parents to give you money by next Monday as the governor has asked us to request for more donations. Yes, the governor of Imo State, Sam Mbakwe, has sent notes to all citizens to send him money to build an airport. Someone shared a partial list of the donors. I knew that I contributed 25 kobo. Someone commented on the post: “I contributed as well. Millions across the East contributed. School children – nursery, primary and secondary students contributed.”
In my Platform presentation, I asked this question: “How many of you will contribute money and send it to a current governor in Nigeria?” Interestingly, President Buhari found those men corrupt, as he took them out via a coup. Now, see what we have where corruption is now Article xx in the constitution!